Nontraded BDCs Post High Returns So Far in 2016, and Top BDC Performer
August 26, 2016 | by Jared Schneider | Blue Vault
Nontraded BDCs have performed very well through the second quarter of 2016 posting a 5.92% average total return year-to-date (or on an annualized basis, that is an 11.84% return). The top performer was NexPoint Capital, Inc., with a 19.36% year-to-date total return.
This comes after a difficult 2015, when the credit markets were experiencing some volatility and BDCs posted a negative 1.57% return on average. Traded BDCs in the same year experienced declines of 15%-30%.
Although the outsized double digit gains of 2012 and 2013 are not to be expected going forward, it’s possible that 2016 sees another double digit total return for nontraded BDCs.
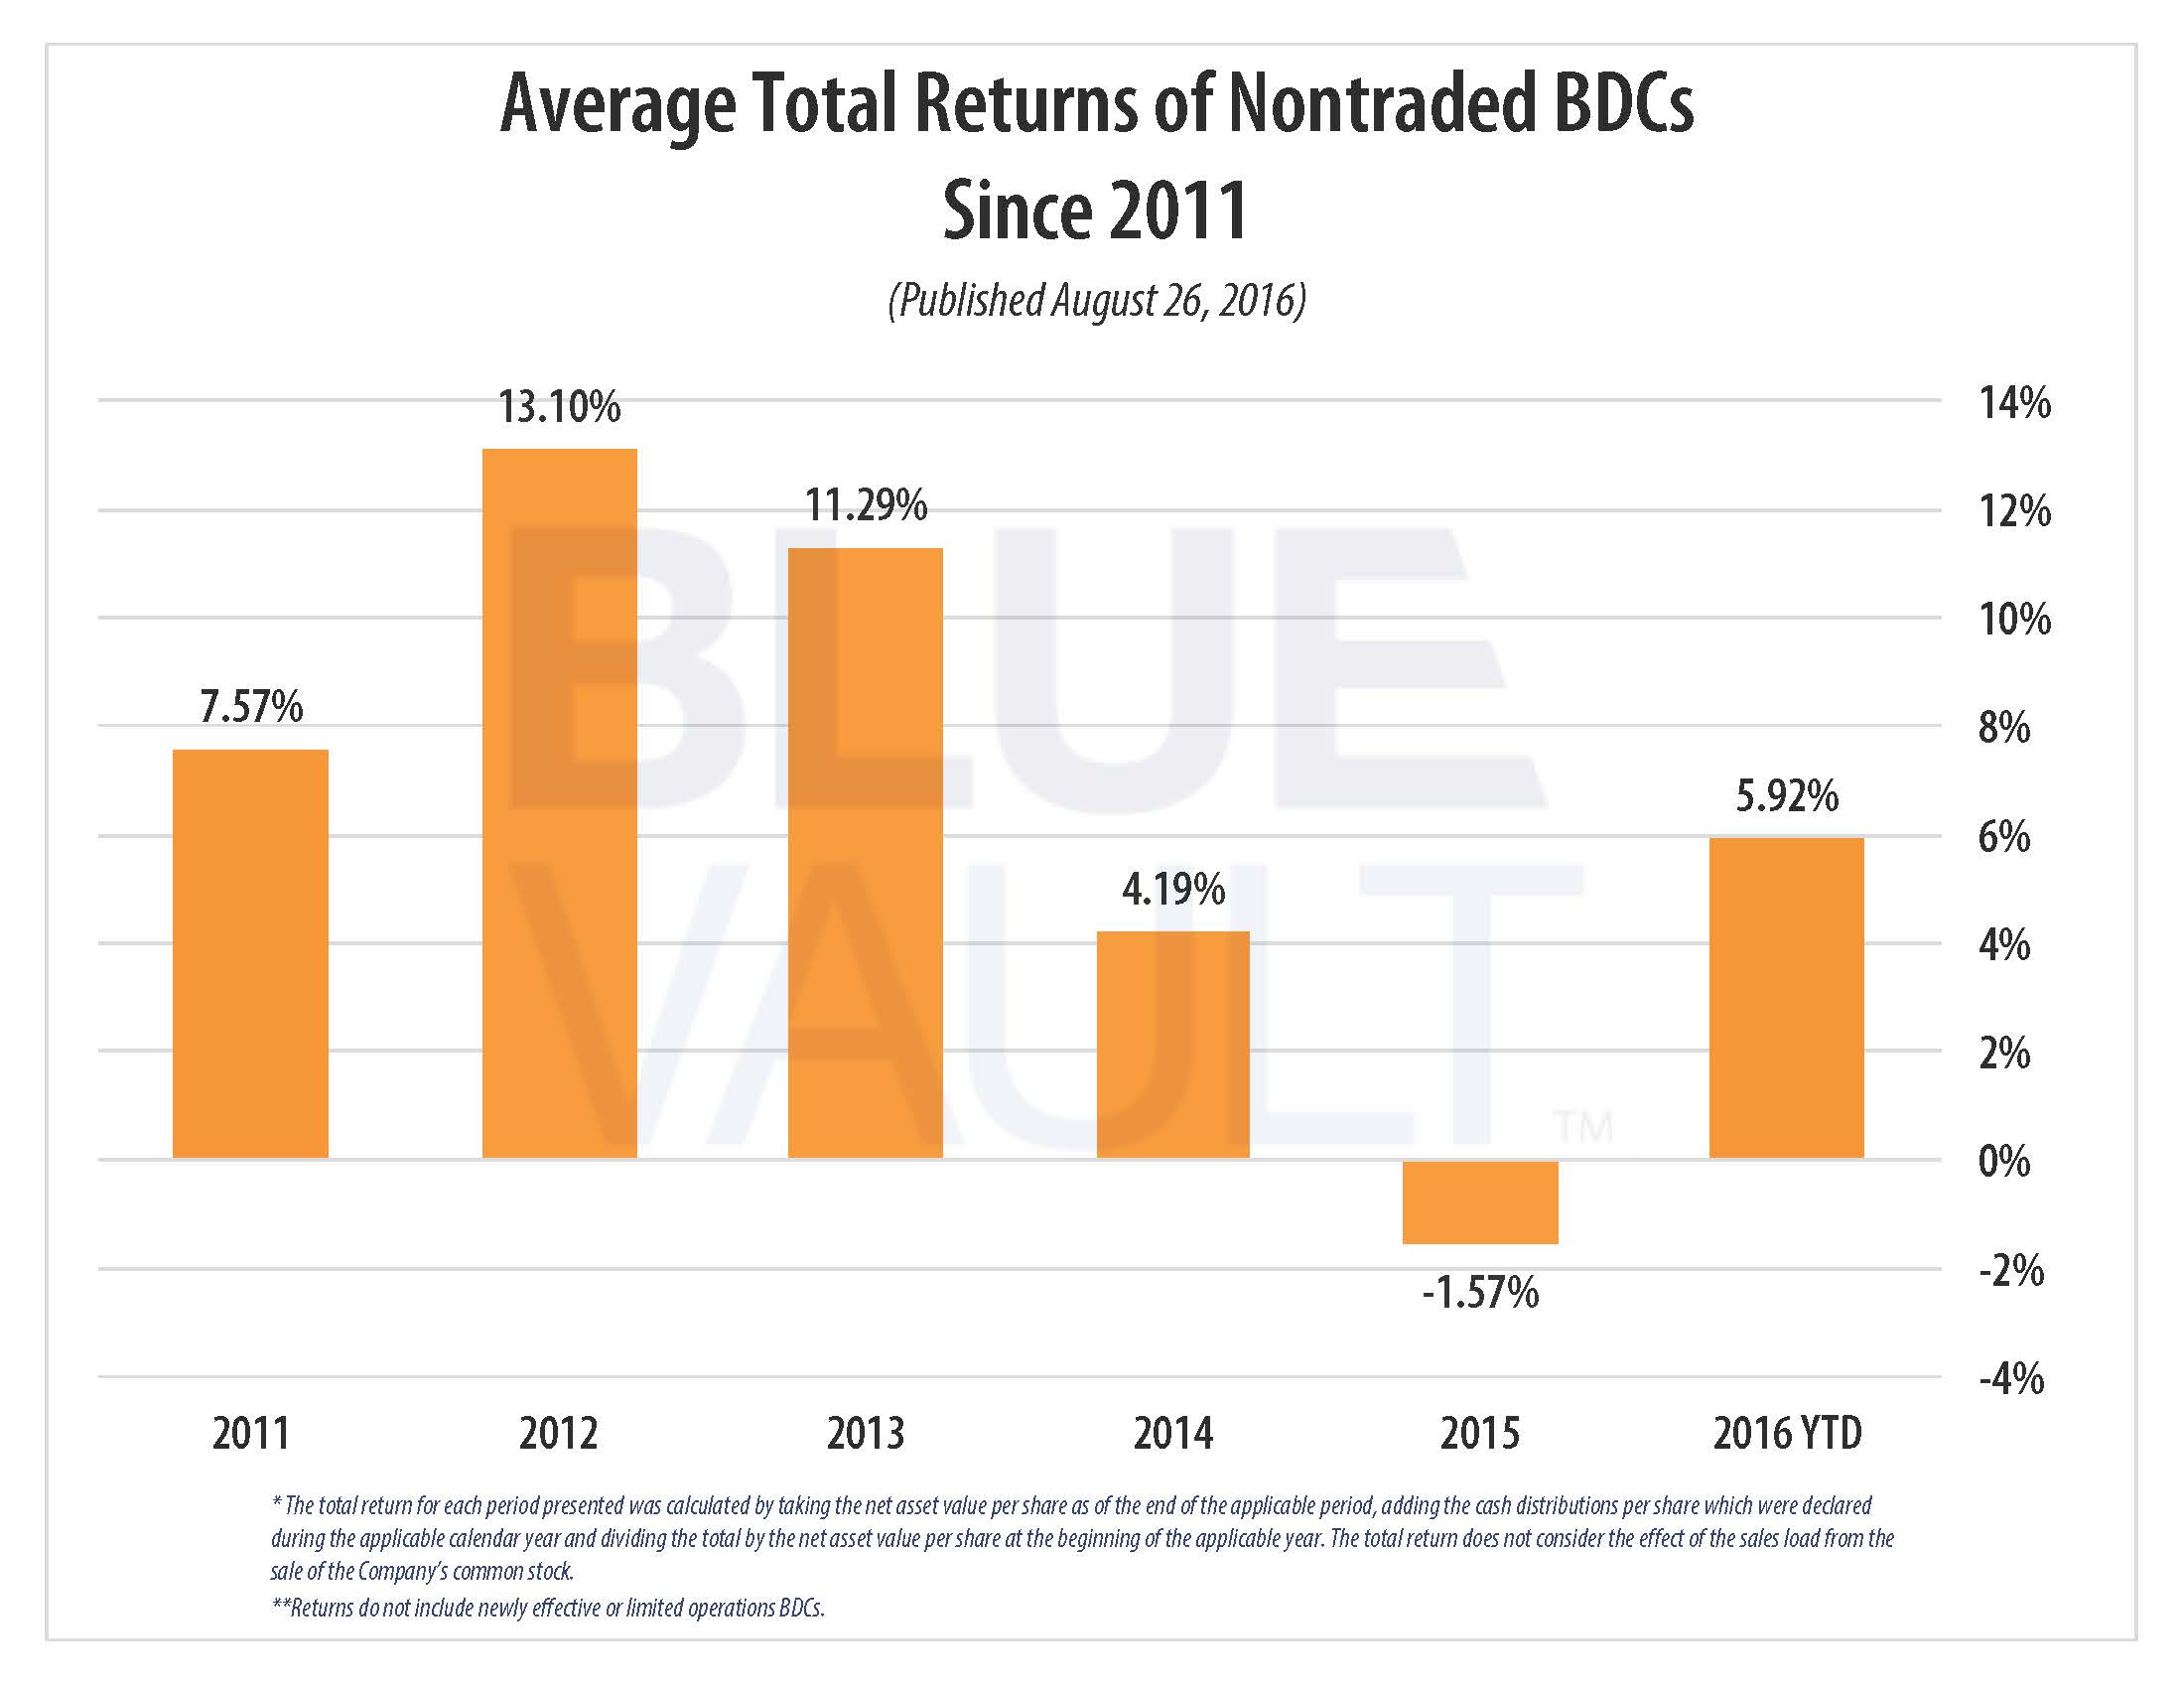
* The total return for each period presented was calculated by taking the net asset value per share as of the end of the applicable period, adding the cash distributions per share which were declared during the applicable calendar year and dividing the total by the net asset value per share at the beginning of the applicable year. The total return does not consider the effect of the sales load from the sale of the Company’s common stock.
** Returns do not include newly effective or limited operations BDCs.
BDCs Outperforming Their Benchmarks
Additionally, in comparison nontraded BDCs have typically outperformed benchmark indices, which Blue Vault tracks in its Nontraded BDC Quarterly Review. Since 2011, BDCs have annually outperformed the S&P/LSTA Leveraged Loan Index and the Bank of America Merrill Lynch High Yield Index by over 4.5% and 2.75% respectively.
For more analysis on the industry and research on individual BDCs, look for Blue Vault’s 2nd Quarter 2016 Nontraded BDC Review in the coming weeks.
Blue Vault’s Nontraded BDC Review is available to our paid subscribers each quarter. For more information about becoming a subscriber, click on the button below.
Blue Vault Subscription Information
More News on Blue Vault’s website about NexPoint Capital, Inc.:
NexPoint Multifamily Capital Trust Announces First Distribution
NexPoint Capital, Inc. Announces Tender Offer For Common Stock