James Sprow | Blue Vault |
The total returns to shareholders in continuously offered nontraded REITs were consistently positive throughout 2021 and into March 2022. All 11 of the continuously offered NAV REITs reported positive returns and a median total return for the group of 2.26% in March 2022. If annualized, that monthly return would equate to around 31%. The total returns are calculated using the change in the net asset value per share (NAV) and the cash distributions as a percentage of those NAVs. Since all of these REITs have multiple share classes, we report total returns to Class I shareholders for nine REITs and Class A shareholders for Jones Lang LaSalle Income Property Trust and Class IX for Cantor Fitzgerald Income Trust. These share classes do not have fees deducted from the distributions.
Chart I shows the total returns reported by the REITs on their websites on the “Performance” pages. These performance figures are usually updated on the REIT websites several weeks after the end of the month, which means the performance data for March 2022 has now been updated for 10 REITs and estimated for FS Credit Real Estate Income Trust based upon its distribution yield and no increase in its estimated NAV per share.
Chart I
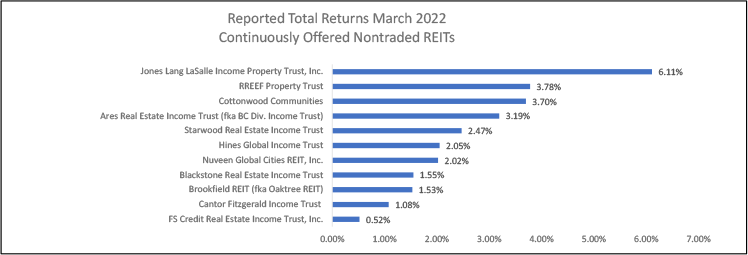
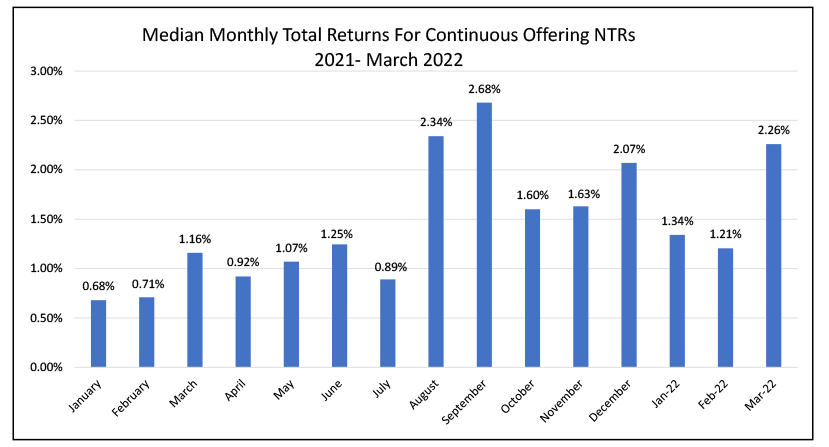
Chart II shows the median total shareholder returns of all continuously offered nontraded REITs for each month since January 2020 for those share classes with no shareholder servicing fees deducted (Class I, Class A and Class IX as stated above).
Chart II
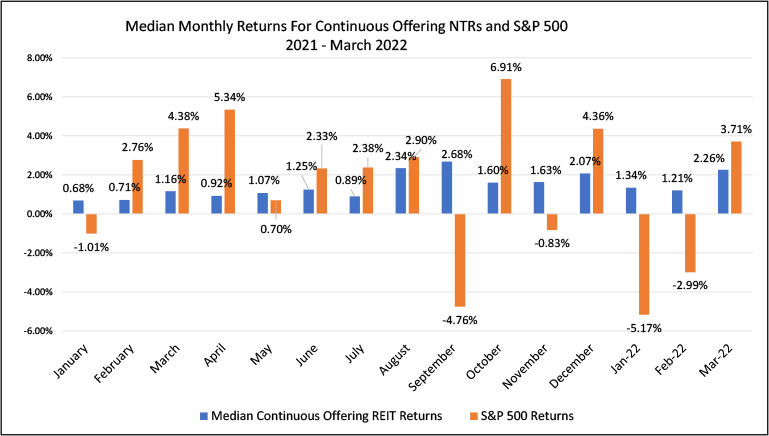
For comparison, the total returns for the S&P 500 Index are shown in Chart III. The median returns for the nontraded REITs have very low month-to-month variation and have not had a negative median return since March 2020. The S&P 500 returns were negative five months out of 15. The standard deviation for the median nontraded REIT returns over the 15-month series was just 0.63% while the standard deviation for the monthly S&P 500 returns over the same period was 3.65%, or 6X greater. Notably, while the S&P 500 index had cumulative negative returns of over 3.3% in the first three months of 2022, the cumulative median returns for the continuously offered NTRs was a positive 4.9%.
Chart III
Source: Blue Vault, SEC and REIT websites