What Happened When American Finance Trust Listed?
January 18, 2019 | James Sprow | Blue Vault
The previously nontraded REIT American Finance Trust (originally American Realty Capital Trust V, Inc.) listed its Class A common shares on Nasdaq on July 19, 2018, under the ticker “AFIN.” The listing did not result in total liquidity for its common stockholders. Rather, only 50% of AFIN’s common shares were freely tradeable upon listing. To effect the listing and address the potential for selling pressure that may have existed at the outset of the listing, the REIT listed only its Class A common stock. The REIT had created two other classes of common stock, Class B-1 and Class B-2, each representing approximately 25% of the company’s outstanding common shares. The Class B-1 shares automatically converted to Class A shares on October 10, 2018, and the Class B-2 shares converted to Class A shares on January 9, 2019.
At the first partial listing, on July 20, 2018, the Class A shares opened at $15.00 and traded as high as $15.19 and as low as $13.98, closing at $13.98.
On October 10, 2018, a 25% “tranche” (the Class B-1 common shares) were converted to Class A shares and were freely tradeable. The closing price on October 11, 2018, was $14.55.
Related: AFIN B-1 Shares to Convert on October 10, Increases Credit Facility
The final 25% “tranche” (the Class B-2 common shares) were converted into shares of Class A common stock on January 9, 2019. Upon the completion of the conversion of the Class B-2 common stock, all the REIT’s outstanding common stock became Class A common stock listed on Nasdaq. The closing price on January 10, 2019, was $13.19.
Pricing and trading volume data from Yahoo!Finance does not appear to support the theory that common shareholders who owned the Class B-1 and Class B-2 shares would be liquidating those shares in high volume when they converted to Class A shares and became exchange tradeable. By far the highest trading volume for AFIN shares occurred over a three-day period from September 19, 2018, through September 21, 2018. That was three weeks prior to the October 10, 2018, conversion of the Class B-1 tranche to Class A shares. Daily trading volume over those three days averaged 1.94 million shares, almost six times the average daily trading volume of 0.336 million shares over the previous 43 days following the initial listing. Over those three days, the closing price for AFIN rose slightly from $17.51 on September 18 to close at $17.53 on September 21. Subsequently, by the time the Class B-1 shares, representing roughly 25% of the REIT’s outstanding common shares, became exchange tradeable on October 10, the closing price had fallen to $14.96 on October 10 and $14.55 on October 11, a drop of 17% since the September 21 close.
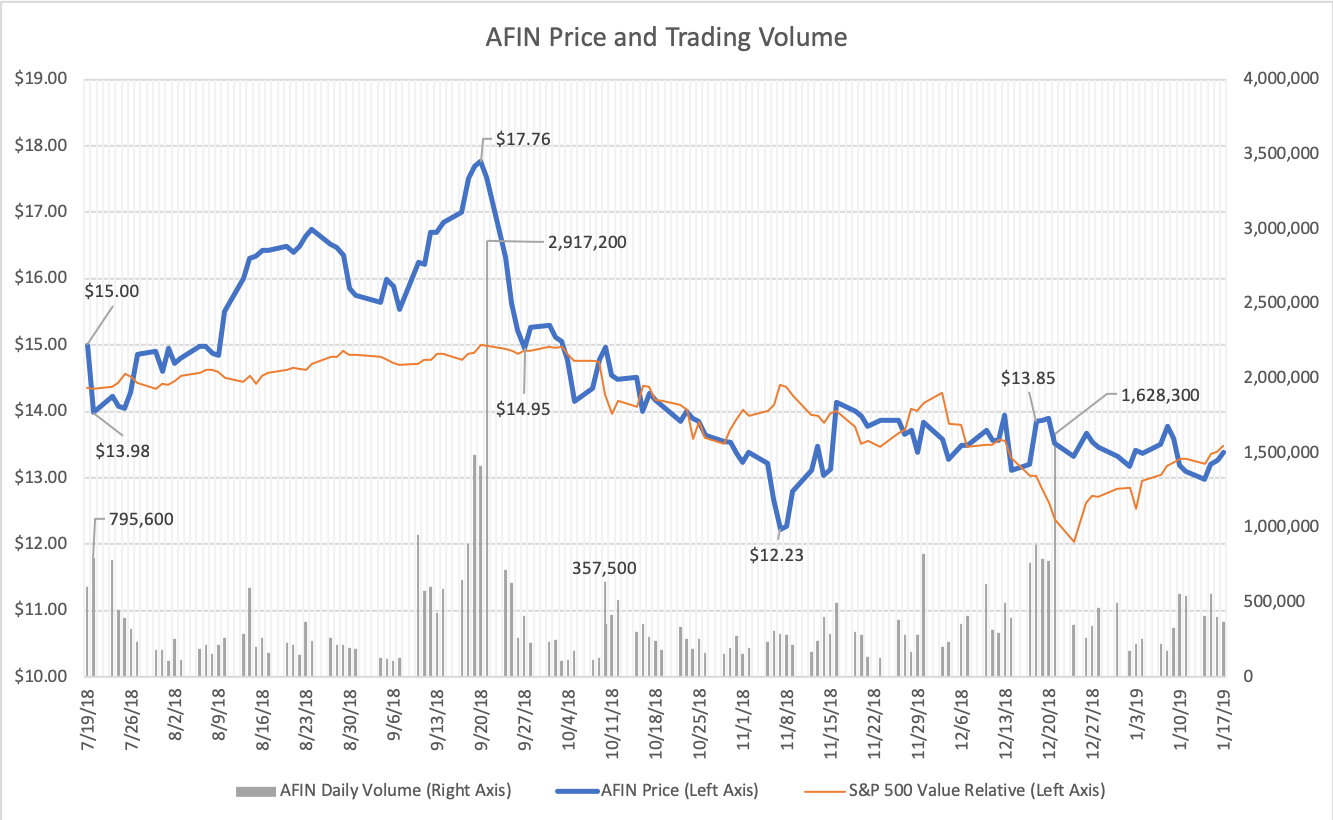
When the second tranche of Class B-2 common shares converted to Class A shares and became exchange tradeable on January 9, 2019, trading volume was 331,300 shares on January 9 and 559,100 shares on January 10, not significantly greater than the 354,177-share average for the 59 trading sessions after the October 10, 2018, conversion. The closing price of the Class A shares, now representing 100% of the outstanding common shares of AFIN, was $13.60 on January 9 and $13.19 on January 10, down over 9% from its close on October 11, the day after the B-1 shares were converted.
Related: American Finance Trust Announces Class B-1 Shares to Convert on October 10
Did broader market factors play a role in the performance of AFIN shares from its first listing to its final conversion that allowed all common shares to be traded? We can see that the broader market did somewhat explain the performance of AFIN, as the correlation of pricing for AFIN and the S&P 500 index was 0.65 from the July 19, 2018, AFIN listing to the January 9, 2019, listing. The unexplained price behavior from the initial listing of 50% of AFIN shares on July 19, 2018 to September 20, 2018, when it reached a high of $17.76 per share and subsequently fell to $14.96 on October 10, 2018, at the time of the Class B-1 share conversion, is difficult to explain. The conversion dates for the Class B-1 and B-2 tranches were announced prior to the AFIN initial listing, so investors and traders could easily anticipate any increased selling activity by investors seeking liquidity.
Apparently that increased selling activity didn’t materialize, and didn’t cause the AFIN share price to drop significantly. Rather, the more significant run-up in price occurred after the initial listing and well before the B-1 share conversion, and the fall in AFIN share price occurred after the B-1 conversion and reached the $12.23 low on November 7, two months before the final B-2 share conversion.
Simple explanations for the price behavior of AFIN shares must be found elsewhere, if they exist,. What caused the spike in trading volume around September 20, 2018, and again from December 17 to December 21, 2018? Given that AFIN investors had clearly suffered significant losses from their initial investments at $25.00 per share, tax-loss selling in December is a leading candidate as a partial explanation. Taxpayers have an incentive to sell their investments that have capital losses in order to offset their capital gains on recently sold or appreciated assets within a tax year.
Sources: Yahoo!Finance, SEC, Blue Vault

Learn more about AR Global on the Blue Vault Investment Manager page