Where Starwood REIT is Investing
January 5, 2022 | James Sprow | Blue Vault
The nontraded real estate investment trust sponsored by Starwood Capital, Starwood Real Estate Income Trust, is the second largest nontraded REIT with $18.2 billion in total asset value as of November 30, 2021, trailing only Blackstone Real Estate Income Trust, the behemoth in the industry with its $78 billion in total asset value as of the same date. The Starwood REIT was 94% invested in real estate, and 3% invested in both real estate loans and real estate securities.
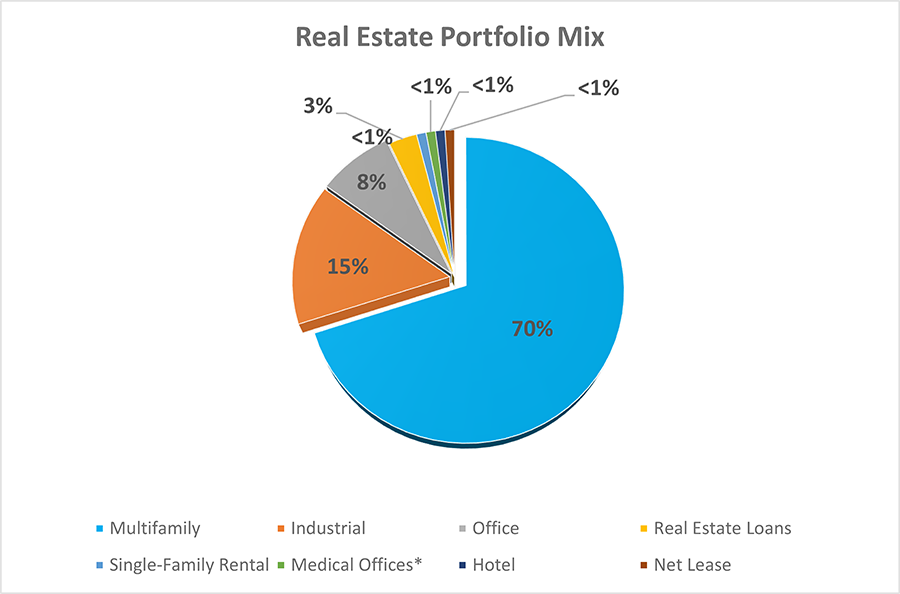
Looking at the asset types in which Starwood REIT is investing, the large majority of the REIT’s portfolio is in multifamily assets (70%), followed by Industrial (15%), Office (8%) and Real Estate Loans (3%). Combined, Single-Family Rental, Medical Offices, Hotels and Net Lease properties make up less than 4% of the portfolio.

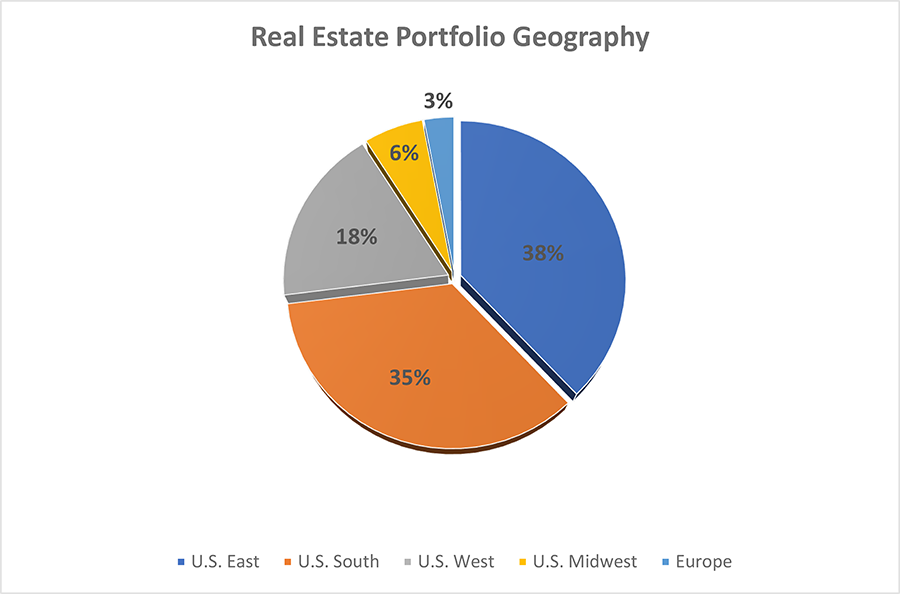
The REIT’s real estate portfolio is most heavily concentrated in the U.S. East and U.S. South regions, with 38% and 35% of the properties, respectively. About 18% of the portfolio is located in the U.S. West, followed by just 6% in the U.S. Midwest and 3% in Europe.
In the third quarter of 2021, Starwood REIT increased their Multifamily portfolio by 12 properties comprised of 3,847 units. Acquisitions of Industrial properties increased that portion of the portfolio in Q3 2021 by 19 properties comprised of 3,180,000 square feet. The REIT did not acquire any additional Office properties or Hotel properties. The number of Healthcare properties has remained at three since Q1 2020.
On November 11, 2021, the REIT acquired a Multifamily portfolio comprised of 62 apartment communities with a total of 15,460 units. The portfolio is 97% occupied at the time of the closing and offers affordability with high-quality amenities. The properties are located across 27 markets and 10 states, with concentrations in Atlanta (19% of NOI), Greater Washington, D.C. (14%), Knoxville (10%), Seattle (9%), and Denver (7%). The portfolio’s markets are experiencing substantial population, employment and income growth. Both the portfolio’s market populations and jobs grew 1.6x and 2.0x faster than the national average over the last five years. According to the U.S. Bureau of Labor Statistics, the SEG Portfolio’s market populations are projected to grow 1.2% annually over the next 5 years, which is 2.0x the projected rate of the United States, while employment growth across these markets is projected to average 1.4% annual growth over the same time period, which is 2.1x the projected rate of the United States. These markets offer lower taxes and a cost of living below the national average, and continue to benefit from migratory trends toward the Sun Belt and other growth markets.

Performance
Starwood Real Estate Income Trust was launched in 2018 with an initial net asset value per share (NAV) for Class I shares of $20.00. By November 30, 2021, the NAV had increased to $25.65 and the total returns in 2021 alone were 24.44%. This rate of return reflects the percentage change in NAV from the beginning of 2021 through November 30, 2021, plus the amount of distributions per share declared during that period. The annualized distribution rate for Class I shares based upon the prior month’s net asset value, inclusive of all fees and expenses, was 5.00%. For the entire 11 months through November 30, 2021, the REIT had positive monthly total returns to its Class I shares ranging from 0.54% in January 2021 to 4.48% in August 2021.
Sources: SEC, Starwood REIT website, S&P Global Market Intelligence


