Performance of Listed REITs and Traditional Indices Q3 2018
December 6, 2018 | James Sprow | Blue Vault
NAREIT publishes historical returns for listed REITs each month, including returns for each sub-sector by property types of the listed REIT sector. The year-to-date returns for the different listed REIT sectors vary from a high of 7.36% total return for the Industrial REIT sector to a low of -4.71% for the Diversified sector. The average total year-to-date return for all equity REITs has been 1.81%, which is in positive territory only due to the dividend yield of 4.19%.
| Listed Equity REITs | ||
| Investment Performance by Property Sector | ||
| Sector (No. of REITs) | Total Return 2018 YTD (%) | Dividend Yield (%) |
| FTSE Nareit Equity REITs (163) | 1.81 | 4.19 |
| Industrial (13) | 7.36 | 3.09 |
| Office (23) | -2.98 | 3.32 |
| Retail (33) | -1.33 | 4.86 |
| Apartments (14) | 5.42 | 3.13 |
| Diversified (17) | -4.71 | 4.94 |
| Health Care (18) | 4.36 | 5.91 |
| Self Storage (5) | 0.83 | 4.03 |
| Data Centers (5) | -0.89 | 2.82 |
Comparing the year-to-date returns for listed REITs (FTSE NAREIT All Equity Index) to traditional stock market indices shows traded REITs lagging significantly, both year-to-date and in the Q3 2018 returns. However, over the past 20 years, the listed REITs have significantly out-performed the common stock returns.
| Selected Indicators of Equity Market Performance | |||
| As of September 30, 2018 | Total Return 2018 YTD (%) | Q3 2018 Returns (%) | 20-Year Average Returns (%) |
| FTSE NAREIT All Equity Index | 1.78 | 0.50 | 10.11 |
| S&P 500 | 10.56 | 7.71 | 7.42 |
| Dow Jones Industrials | 8.83 | 9.63 | 8.78 |
| Russell 2000 | 11.51 | 3.58 | 9.45 |
| NASDAQ Composite | 17.48 | 7.41 | 8.10 |
Correlation of Listed REIT Returns and Traditional Index Returns
The value of any investment within a portfolio is measured not just by its average rate of return, but also by its impact on portfolio volatility. Commercial real estate investments can potentially reduce portfolio volatility when combined with other securities when the correlation of returns to those of different investments is significantly less than 1.0 as measured by the correlation coefficient. The following tables illustrate two facts: 1) The total investment returns of listed equity REITs are not as highly correlated with stock returns as the various stock indices are with each other. 2) The correlations of listed equity REITs with the stock market indices have increased over time (the more recent time period of 2008 to 2018 has mostly higher correlations than the longer time period of 1988 to 2018). This means that, over time, the investment returns of listed equity REITs have been increasingly related to the returns on other listed stocks, reducing the potential diversification benefits of listed REITs within a portfolio of other listed stocks. Expressed differently, more of the volatility of returns of listed REITs can be explained by the volatility of the broader stock market than in the past.
| Correlation of All Equity REIT Returns with Major Indices | |||||
| Period for September 2008 – September 2018 | |||||
| Index | FTSE NAREIT All Equity Index | S&P 500 | Dow Jones Industrials | Russell 2000 | NASDAQ Composite |
| FTSE NAREIT All Equity Index | 1.000 | 0.743 | 0.694 | 0.752 | 0.694 |
| S&P 500 | 0.743 | 1.000 | 0.972 | 0.906 | 0.949 |
| Dow Jones Industrials | 0.694 | 0.972 | 1.000 | 0.860 | 0.957 |
| Russell 2000 | 0.752 | 0.906 | 0.860 | 1.000 | 0.898 |
| NASDAQ Composite | 0.694 | 0.949 | 0.957 | 0.898 | 1.000 |
| Correlation of All Equity REIT Returns with Major Indices | |||||
| Period for September 1988 – September 2018 | |||||
| Index | FTSE NAREIT All Equity Index | S&P 500 | Dow Jones Industrials | Russell 2000 | NASDAQ Composite |
| FTSE NAREIT All Equity Index | 1.000 | 0.547 | 0.509 | 0.732 | 0.724 |
| S&P 500 | 0.547 | 1.000 | 0.988 | 0.804 | 0.834 |
| Dow Jones Industrials | 0.509 | 0.988 | 1.000 | 0.876 | 0.885 |
| Russell 2000 | 0.732 | 0.804 | 0.876 | 1.000 | 0.854 |
| NASDAQ Composite | 0.724 | 0.834 | 0.885 | 0.854 | 1.000 |
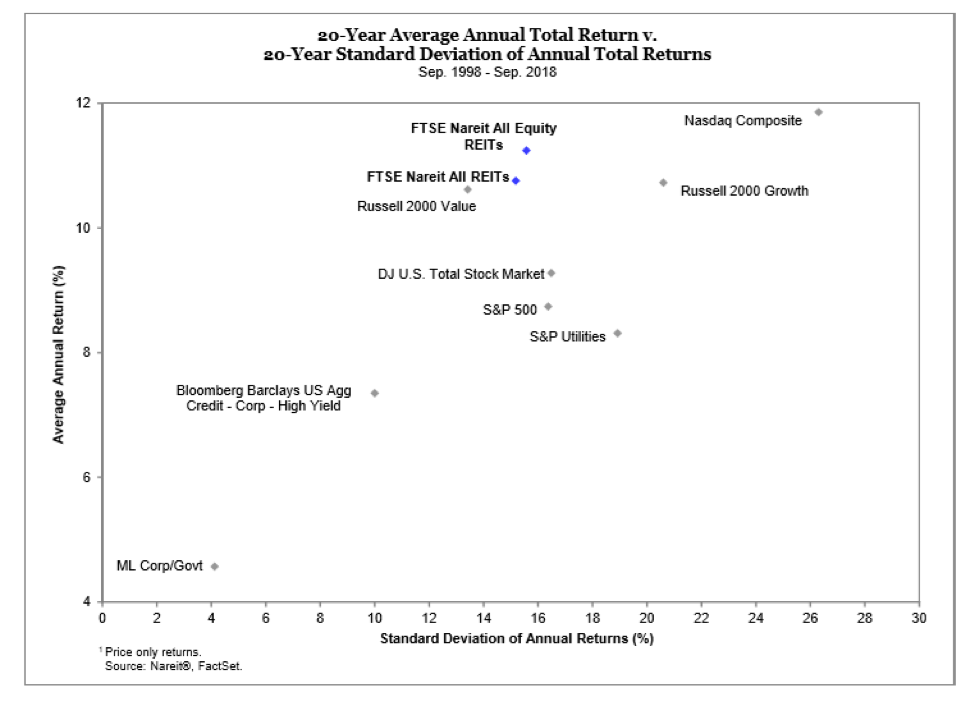
NAREIT compares the average annual returns for All Equity REITs and other stock and bond indices for the 20-year period September 1998 to September 2018. The FTSE NAREIT All Equity REITs show a higher average rate of return and lower volatility compared to the Dow Jones Total Stock Market, S&P 500, Russell 200 Growth, and S&P Utilities indices. The volatility of the FTSE All Equity REITS is significantly lower than the Nasdaq Composite index, but with slightly lower average returns. In terms of portfolio theory, these returns and volatility metrics place listed All Equity REITs on an efficient frontier, meaning they should be considered when diversifying a common stock portfolio.

Conclusion
• The 163 listed REITs in NAREIT’s All Equity REIT Index have lagged the other stock market indices in total returns year-to-date through September 30, 2018.
• Over the last 20-year period, All Equity REITs have significantly outperformed other stock market indices in their compound annual rates of return.
• Lower correlations and lower volatility of returns relative to other stock indices suggests that listed REITs are a logical choice for portfolio diversification, potentially raising returns while reducing portfolio volatility.
Source: NAREIT at www.REIT.com


