A Deeper Dive into Strategic Storage Growth Trust’s Full-Cycle Performance
Maria Smorgonskaya and James Sprow | Blue Vault
On January 24, 2019, Strategic Storage Trust II (SST II) acquired Strategic Storage Growth Trust by way of a merger. Upon completion of the merger, each share of Strategic Storage Growth Trust (SSGT) common stock (consisting of Class A and Class T common stock) was converted into the right to receive an amount in cash equal to $12.00 per share. The merger was consummated after considerable back-and-forth negotiations between the boards of SSGT and Strategic Storage Trust II1.
SSGT shareholders received the highest IRR among eight REITs with full-cycle events occurring between January 31, 2018, and January 24, 2019. The early investors of SSGT received 8.04% IRR, middle investors 6.18%, and the late investors 7.21%. These estimated returns were calculated by Blue Vault using all cash distributions paid to early, middle and late investors, assuming all investment and distribution cash flows occurred at the end of each quarter, and the liquidating value paid at the merger date. The returns are calculated without assuming distribution reinvestments. Distribution reinvestments at a discount to the offering price will increase estimated shareholder returns when positive capital gains are achieved.
In this “deeper dive” we look at whether SSGT used financial leverage successfully and the other ways in which the REIT managed its portfolio of self-storage properties to create value for shareholders.
Strategic Storage Growth Trust’s Use of Debt Financing
It is interesting to track how SSGT used debt during the life of the REIT, and whether or not the financial leverage contributed to stockholder returns. The REIT’s initial offering was declared effective in Q1 2015. Initially, the REIT increased its debt through the Q3 2016 to a maximum level of $41.6 million, bringing its debt-to-assets ratio to 43%. During that period $62 million was raised in its public offering, only 23% of the total capital raised over the duration of the offering. In Q4 2016, 70% of the debt was paid off, with further debt reductions through Q1 2018, when debt outstanding was at its lowest level of $2.3 million, bringing the debt-to-asset ratio to just 1%. Taking into consideration possible timing issues related to GAAP reporting and how fast capital raised by broker-dealers can be reflected in the official filings of the REIT, we can assume that SSGT was able to pay off almost all its debt with the $172.5 million or 63% of the total offering proceeds raised in Q1 2017.
Table I
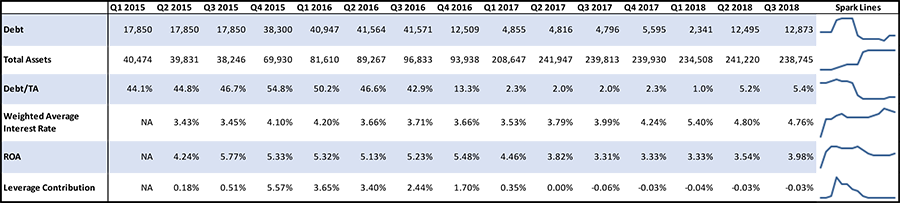
We use the Leverage Contribution calculation to measure the degree to which the use of debt adds to shareholder returns. In simple terms, if a REIT generates a return on assets (ROA) that exceeds its cost of borrowing, a positive spread between the ROA and interest rate on debt increases shareholder value. The Leverage Contribution metric measures the impact on the REIT’s return on equity due to the use of debt financing and the spread between the average rate of interest on debt and the REIT’s return on assets. Whether measured in accounting terms as return on equity (ROE) or revealed as it increases the value of the shareholder’s ownership interest in the REIT, reflected in the REIT’s net asset value per share, the use of leverage and a positive Leverage Contribution should eventually increase the full-cycle value per share, other things equal.
Looking at the twelve months trailing Leverage Contribution for SSGT, we see that it was positive until Q3 2017, when the weighted average interest rate on debt was higher than the REIT’s return on assets. After Q3 2017 the Leverage Contribution was negative, but because the level of debt financing had been reduced to such low levels (2% to 5% debt-to-assets ratios), it had very little impact on stockholders returns.
Analyzing the True Cost of Debt Financing
Blue Vault uses the weighted average cost of debt in calculating the Leverage Contribution metric. The weighted average cost of debt is based upon the weighted average interest rates charged by lenders for each loan shown in the quarterly financial statements of the REIT, using the balance due as the weighting factor. This metric is calculated by Blue Vault or provided by the REIT each quarter. However, when debt issuance costs are included in estimating the cost of debt financing, a more accurate picture emerges. In the case of Strategic Storage Growth Trust, debt issuance costs were substantial over the life of the REIT.
Table II
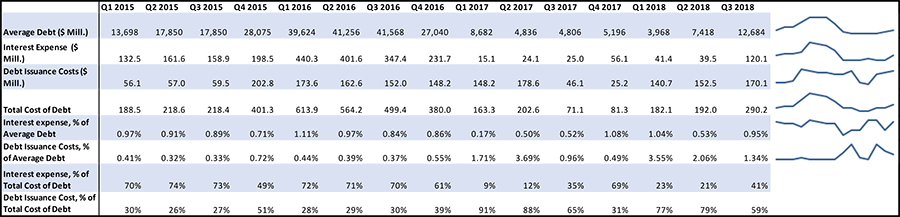
From Q1 2015 thru Q3 2018, SSGT’s interest expense totaled $2,394 million. The debt issuance costs, consisting of points paid to the lender, lender’s attorney’s fees, borrower’s attorney fees and other direct costs of issuing the debt, over the same time period totaled $1,873 million. Taken together, a more accurate description of the REIT’s cost of debt financing would be $4,267 million during the period, of which 56% was interest expense and 44% was debt issuance costs. The average debt balance on the REIT’s Balance Sheet over the period was $18.4 million, meaning that, on an annualized basis, the costs of debt financing averaged an additional 2.71% for debt issuance costs alone, bringing the average total cost including both interest expense and debt issuance costs to over 6% annually.
SSGT’s Debt/TA ratio changed significantly during the 15 quarters considered in this study, from 50% (maximum reached in Q1 2016) to 1% (minimum reached in Q1 2018). In terms of dollars, the maximum outstanding debt SSGT had on its Balance Sheet was approximately $41.6 million, and the minimum amount was $2.3 million. Based on this wide spread for the debt outstanding, we would expect that the cost of debt for the company would change in proportion. If we look at Table II, we can see a correlation between Interest Expense and Average Debt for a quarter, calculated as an average of the beginning and ending values. But, if we look at the second component of the Total Cost of Debt for SSGT, Debt Issuance Cost, we can see that it can contribute as low as 26% and as high as 90% to the Total Cost of Debt per quarter. Debt Issuance Costs were especially high in 2018, when the average debt was relatively low. Debt Issuance Costs are incurred at the time the financing is obtained, but under GAAP they are amortized over the maturity period of the loan. Any unamortized portion remaining when the loan is paid off prior to maturity is expensed in that quarter. This explains how the expense can appear even when debt balances fall. Although this second component of the Total Cost of Debt follows GAAP rules in terms of when it appears on the Income Statement (expensed or amortized), the significant portion of Debt Issuance Cost in the Total Cost of Debt requires us to re-think our rate calculation if the Debt Issuance Cost was not included in the Total Cost of Debt.
Chart I
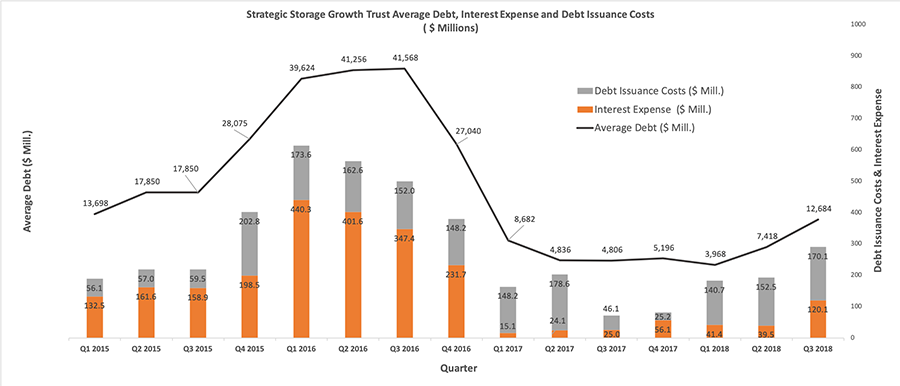
When the total cost of debt financing is considered, the REIT’s use of leverage to enhance shareholder returns becomes more problematic. In no quarter of the REIT’s life did its return on assets (NOI/Average Total Assets), calculated over rolling 12-month periods, exceed 6%, indicating that the true cost of utilizing debt financing consistently exceeded the REIT’s ability to generate a GAAP-based return on its assets. At first glance, this suggests that the REIT’s use of debt, particularly during the offering period before offering proceeds were sufficient to pay down debt, could be a net drag on shareholder returns.
To better explain the full-cycle returns to SSGT’s shareholders, we must look beyond the use of financial leverage.
Portfolio Performance
As with most commercial real estate portfolios, no matter what asset class is included, REITs can create shareholder value by purchasing assets that appreciate in value over time. Appreciation of commercial real estate assets can be due to external factors such as lower capitalization rates generally or lower capitalization rates in the REIT’s specific market sector or asset type. Appreciation can also be attributed to wise evaluations by management when “buying low and selling high.” Wise capital improvements to acquired assets or development of new properties will also add to portfolio values. Operationally, management can also build value by increasing net operating income (NOI), which will be a function of occupancy rates, rental rates and expenses. Increasing occupancy, increasing rental rates, controlling expenses, and making profitable capital improvements will lead to a more valuable portfolio and increasing net asset values per share.
Looking at the occupancy rates at the self-storage properties within the SSGT portfolio over time, we see that from 2014 (when the first properties were acquired) through 2017, the majority of the properties within the portfolio showed occupancy rate increases. This trend reversed later on, toward the end of SSGT’s existence. Comparing December 2017 and December 2018 occupancy rates (for those properties with data for comparison), we see that 12 properties out of 17 had decreases in their respective occupancy rates. Despite occupancy rates decreasing in the period from December 2017 to December 2018, the total revenue of SSGT grew every quarter (through Q3 2018). Yardi Matrix reported that U.S. year-over-year self-storage rental rates declined by 1.7% nationally as of December 2018 for the average 10X10 non-climate-controlled units and declined 1.5% for 10X10 climate-controlled units. Larger units (10X20) saw a 3% decline in rental rates in 2018. Despite these national trends, SSGT was able to increase total revenues by 32% year-over-year in Q3 2018 and 10% from Q2 2018.
SSGT’s net operating income (NOI) increased in ten quarters out of 14 with data available for comparison. (See Chart II) NOI was up 67% year-over-year in Q3 2018 and up 15.7% from Q2 2018 to Q3 2018. Operating expenses were up only 3.0% in Q3 2018 from Q2 2018, and year-over-year operating expenses in Q3 2018 were up only 6.4%.
Chart II
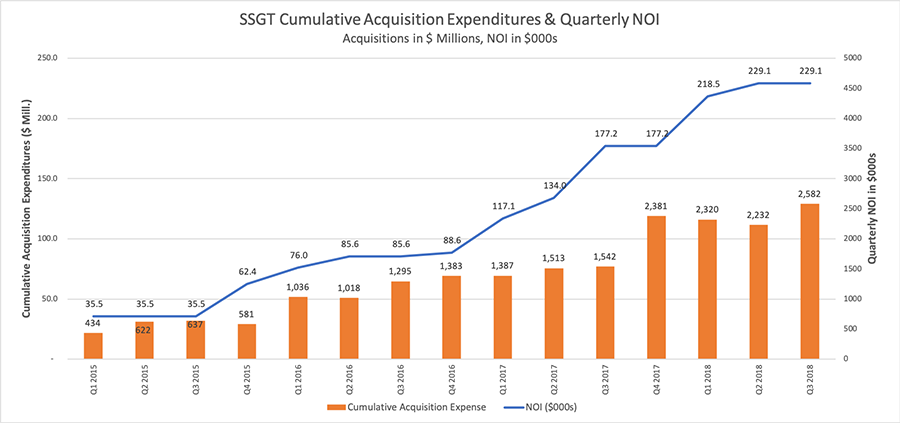
Comparing same-store performance, the REIT reported a 5.6% increase in quarterly revenues between Q3 2017 and Q3 2018, and a 9.4% increase in NOI, despite average physical occupancy for the same 15 properties decreasing from 93.6% to 88.3%. Revenues increased despite the fall in average occupancy because annualized rents per occupied SF increased from $12.37 to $13.91 over the period. For the nine months ended September 30, 2018, same store revenues increase 8% and NOI increased 11.9% while average physical occupancy declined from 93.1% to 88.7%. Again, NOI increased because the annualized rent per occupied SF increased from $12.25 to $13.92. Modified Funds from Operations increased 33% for the nine months ended September 30, 2018 compared to the same period in 2017.
Capital expenditures to improve the properties or develop new self-storage facilities represented a significant portion of total quarterly revenues. For example, in 2017 cash flows for additions to real estate facilities represented 57.4% of 2017 revenues ($8.13 million compared to $13.79 million in revenues). In the first three quarters of 2018, the rental revenues were $14.37 million and additions to facilities totaled $5.36 million or 37.4%.
General and administrative expenses were much higher as a percentage of rental revenues for Strategic Storage Growth Trust when compared with Strategic Storage Trust II. SSGT’s Q3 2018 10-Q states that “General and administrative expenses consist primarily of legal expenses, transfer agent fees, directors’ and officers’ insurance expense, an allocation of a portion of our Advisor’s payroll related costs, legal expenses and Board related costs. The increase in general and administrative expenses is primarily attributable to increases in legal expenses, Board related costs and professional expenses related to our evaluation of strategic alternatives and entry into the Merger Agreement.” These expenses totaled 17% of total revenues for SSGT over the 12 months ended September 30, 2018, compared to less than 6% of total revenues for Strategic Storage Trust II over the same period.
Bottom Line
The $12.00 per share that SSGT shareholders received when the January 24, 2019 merger into Strategic Storage Trust II was completed represented a $2.00 capital gain based upon the $10.00 offering price for SSGT shares. Those common shares purchased via the distribution reinvestment program (DRIP) at $9.50 per share had a $2.50 per share capital gain. On April 19, 2018, the board of directors had approved an estimated net asset value per share of $11.58, as of December 31, 2017. Base on the last 10-Q filed by the REIT for Q3 2018, common shareholders received $12.00 for a book value of equity per share of $7.85. The REIT had real estate facilities with a cost of approximately $251 million and a net book value after depreciation and including construction in progress of $232 million. The merger consideration paid by Strategic Storage Trust II totaled approximately $340 million, including current outstanding debt to be assumed or repaid.2 There were approximately 26.7 million common shares outstanding at the time of the stockholder approval of the merger, indicating a total payment to shareholders of approximately $320 million and approximately $20 million to meet SSGT’s liabilities.
Considering the estimated NAV per share as of December 31, 2017, of $11.58, the $12.00 per share merger consideration as of the merger date of January 24, 2019, represented just a 3.6% increase. Distributions to Class A shareholders were at a 4.00% rate for Q1 and Q2 2018, based upon the $10.00 offering price, and increased to 5.00% for Q3 2018 and Q4 2018. Thus, based upon the $11.58 estimated NAV, Class A shareholders saw roughly a 7.5% return from December 31, 2017 to January 24, 2019.
Footnote 1:
In early March 2018, SSGT was contacted by representatives of SST II to see if there would be interest in considering a potential transaction. SSGT board of directors was familiar with SST II and its portfolio because both were sponsored by SmartStop, an entity that provided real estate advisory, asset management and property management services to SSGT and SST II.
On March 16, 2018, the Companies entered into a nondisclosure agreement.
On May 16, 2018, in light of the possibility of potential conflicts of interest in SSGT board of directors’ consideration of strategic alternatives, including, but not limited to, a potential transaction with SST II, SSGT board of directors and the SSGT governance committee formed the SSGT special committee, and delegated to the SSGT special committee the authority to review and evaluate strategic alternatives for SSGT, including a potential sale of the company or its assets.
The negotiations between the boards of SSGT and SST II took place over several months. The offers and counter-offers are described below.

Strategic Storage Trust II Directors:
H. Michael Schwartz (President, also Chairman and CEO of SSGT)
Paula Mathews (Secretary of SST II and Exec. V.P. of SSGT)
Timothy S. Morris (Independent)
David J. Mueller (Independent)
Harold “Skip” Perry (Independent)
Strategic Storage Growth Trust Directors:
H. Michael Schwartz (Chairman and CEO of SSGT, also President of SST II)
Leon W. Holmes (Independent)
Stephen G. Muzzy (Independent)
Footnote 2
From a filing by Strategic Storage Growth Trust on November 16, 2018:
“Consummation of the Mergers is not conditioned upon SST II obtaining financing and does not require approval by SST II stockholders. The transaction value of the Mergers is approximately $350 million, which includes outstanding debt to be assumed or repaid by SST II as of November 15, 2018, but excludes transaction costs. SST II has represented in the Merger Agreement that it will have sufficient funds to consummate the Mergers. SST II has advised us that it is in the process of negotiating new loans in order to finance the Mergers, which would include the financing of our properties, the refinancing of certain of SST II’s existing properties, and the payoff of certain of SST II’s existing loans.”
Subsequently, Strategic Storage Trust II obtained merger financings for an aggregate amount of approximately $525 million. The proceeds from the merger financings were primarily used to facilitate the merger with SSGT, including the payment of the merger consideration and the repayment, in full, of some of the SST II previously existing debt.
On January 24, 2019, Strategic Storage Trust II entered into various financings, as follows:
– a $235 million commercial mortgage-backed securities (“CMBS”), with KeyBank, National Association and Citi Real Estate Funding Inc. or its affiliates,
– a $104 million CMBS financing with KeyBank as lender pursuant to a mortgage loan,
– a secured financing with KeyBank and SunTrust Bank as co-lenders for an amount up to approximately $96.4 million pursuant to a mortgage loan, and
– a financing for an amount up to $87.7 million with KeyBank and SunTrust, as co-lenders, pursuant to a senior term loan.

Learn more about SmartStop Asset Management, LLC on the Blue Vault Investment Manager page