Blue Vault Nontraded REIT Full-Cycle Performance Study, 7th Edition: Executive Summary
December 7, 2022 | James Sprow | Blue Vault
Between April 1997 and August 2022, 84 nontraded REITs have experienced full-cycle events, providing investors with full liquidity for their common shares.
• The 17 most recent full-cycle events that took place between March 2020 and August 2022 consist of firms with average asset values of approximately $1.42 billion vs. $1.01 billion in the first study published in 2012. The average asset value for all 84 REITs over their lives was $1.25 billion.
• For the purpose of comparison of Conventional IRR (excl. DRIP) to Annual IRR (including DRIP) we exclude Hospitality Investors Trust from the most recent sample of 17 REITs, added to the 7th Edition, due to inability to calculate Annual IRR (including DRIP) for the REIT. Hospitality Investors Trust filed for bankruptcy in 2021. All the cash flows for the stockholders participated in DRIP, including terminating value, equaled $0.00.
• The 16 new REITs (excluding Hospitality Investors Trust) had average annualized full-cycle returns to early investors of 5.04% and median returns of 6.01%, with three experiencing negative average returns to early investors.
• For the full sample of 84 nontraded REITs, 29 listed on public exchanges, 18 were acquired by or merged with nontraded REITs, 19 merged with publicly traded firms, 7 merged or acquired by unlisted firm, and 11 liquidated. It is the third study when REITs liquidated their property portfolios and distributed cash from those liquidations. This is the first full-cycle study when the REIT (Hospitality Investors Trust) filed for bankruptcy.
• For each nontraded REIT, we calculate an internal rate of return (IRR), or average compounded rate of return experienced by investors in two ways. The first IRR calculation assumes no reinvestment of distributions (we call it conventional IRR). The second calculation assumes that all distributions were reinvested at the then-prevailing price for reinvestments (which may include DRIP discounts).
• On average, for the full sample of 84 REITs, an annual IRR (including DRIP) of 5.28% was slightly higher than an annual IRR (excluding DRIP) of 5.20%. For the 16 most recent full-cycle events (excluding Hospitality Investors Trust) the situation with IRRs was the opposite: an average IRR (including DRIP) was 4.57% while an average IRR (excluding DRIP) was 5.04%.
• Realized common shareholder returns for the 84 full-cycle REITs assuming reinvestment of distributions ranged from -11.49% to 20.52% (excluding Hospitality Investors Trust filed for bankruptcy), with an average of 5.28% and a median of 7.14%. Assuming no reinvestment of distributions, the average IRR was 5.20% and the median was 6.81%.
• The average annual distribution yield over the lives of the 84 REITs in this study was 6.20%, using quarters in which distributions were paid and based upon the initial offering prices.
• Consistent with prior studies, this updated study also constructs unique custom benchmark return comparisons for each REIT, with FTSE NAREIT indices for the returns of publicly-traded REITs.
• In the 7th Edition of the Nontraded REIT Full-Cycle Study we do not construct the custom benchmarks using FTSE NAREIT indices for each property type to match the REIT’s portfolios over time. In the 6th Edition and all previous editions of the Full-Cycle Studies we constructed custom benchmarks using both the FTSE NAREIT indices for property types and the NCREIF indices for geographic locations data. Comparing returns for the FTSE NAREIT indices required breaking down the NTR portfolios by property type and comparing the weighted average returns over the property type returns for the appropriate FTSE NAREIT property type returns. The returns calculated for these custom benchmarks were also calculated using adjustments that controlled for differences in leverage and cost of debt.
• For the 7th Edition, we compare the annualized rates of return for investors to both the FTSE All REITs index and the S&P 500 Stock Index over matched holding periods. In addition, we calculate annualized rates of return over matched holding periods for Intermediate-Term U.S. Treasury Bonds.
• When comparing the full-cycle IRRs of the 84 nontraded REITs to the benchmarks, we find that 24 (28.6%) of the 84 REITs outperformed S&P 500 Stock Index, and 14 (16.7%) of the 84 REITs outperformed the FTSE All REITs index. Only 10 (11.9%) REITs outperformed both benchmarks. Of the 84 REITs 59 (70.2%) outperformed the Intermediate-Term U.S. Treasury Bonds benchmark.
• Utilizing the NAREIT and S&P 500 benchmarks for return comparisons controls for differences in investment timing. Thus, an annualized full-cycle return of 5.92% by Chambers Street Properties compares favorably to those benchmarks (FTSE NAREIT 2.82%, S&P 500 1.97%) while a higher average return of 8.25% by Cole Corporate Income Trust does not (FTSE NAREIT 14.69%, S&P 500 13.64%), because of the relative differences in performance of the FTSE NAREIT Index and the S&P 500 Index over those REIT lives.
• Time series correlations of nontraded REIT returns with indices are less meaningful due to the infrequent valuation changes of the REIT shares and the exaggerated impacts that full-cycle valuations have on the quarterly returns series. Estimating the correlation between a market-based or appraisal-based index with quarterly mark-to- market changes and the cash flows of a nontraded REIT does not give a meaningful result. The cash flows for a typical nontraded REIT investment consist, in most cases, of a single outflow in quarter of the initial investment, relatively constant distribution inflows to the investor each quarter, and a single terminating inflow to the investor in the quarter of the full-cycle event. Since serial correlation calculations use the entire data sets of quarterly cash flows and the quarterly distributions have little or no volatility, the correlation coefficient will typically be very low.
• In this study as in the past editions, we calculate a cross-sectional correlation for all 84 full-cycle events which measures the total holding period returns for each nontraded REIT with the matched holding period returns on other assets, including the NAREIT traded REIT index returns, and other indices such as the S&P 500 and Intermediate Term Treasury Bond returns.
• When comparing nontraded REIT full-cycle returns to traditional investment market indices, the average annualized returns on nontraded REITs in the study were 5.20% (without DRIP) and 5.28% (with DRIP), compared to an average total return for the S&P 500 Stock Index of 8.98% over matched holding periods. The Intermediate-Term Treasury Fund benchmark provided average returns of 3.07% over matched holding periods. 24 of the full-cycle REITs (28%) outperformed the S&P 500 Index and 59 out of 84 (70%) outperformed Intermediate-Term U.S. Treasury Bonds.
• The updated study shows insignificant differences in cross-sectional average returns to early, middle or late investors during the offering periods. In 40 instances, mid-offering investors outperformed early investors over their respective holding periods. In 40 instances, late- offering investors outperformed early investors over their respective holding periods. The median returns for early investors (6.81%), middle investors (6.68%) and late investors (6.82%) did display differences due to investment timing, but the average returns for each group were very similar. There were large variations across REITs due to capital gains or losses, with those realized gains or losses having a greater impact on the returns of later investors compared to early investors.
• The average capital loss [(full-cycle price minus initial offering price)/ initial price] for the 84 REITs was 33.13% compared to an average gain of 23.34% in the study, with 43 REITs showing capital gains and 41 showing capital losses, with median capital gain of 17.89% and median capital loss of 28.14%.
• 14 Sponsors and 12 Self-managed REITs (not associated with any of the Sponsors for the purposes of the Full-cycle study) had 84 full-cycle events over the study period. ARC/AR Global had the maximum number of full-cycle events: 14 events with an average annual shareholder return (with DRIP) of 3.75%. In second place was Apple with ten full-cycle events with an average annual shareholder return (with DRIP) of 9.30%. W.P. Carey had eight REITs with an average annual shareholder return of 8.51% (with DRIP).
• Those shareholders who redeemed their shares in the last available period for redemptions prior to the full-cycle event had average returns of 4.65% over their respective holding periods compared to the average full-cycle returns for the same subset of 78 REITs (6 REITs didn’t offer redemption program) of 4.10% (not including DRIP).
• A sample of those shareholders who tendered shares (35 REITs) via 69 third-part tender offers prior to the full-cycle event had average holding period returns of approximately negative 3.52% compared to an average IRR for the full-cycle events of those REITs in the sample of 2.34%, a difference in average returns of negative 5.86%. The tender offer prices in the sample averaged 20.9% less than the full-cycle price. This confirms that third-party tender offers are more likely to be made for REITs that have underperformed their industry averages.
• The performance of the 84 full-cycle nontraded REITs does not appear to be significantly related to the changes in interest rates that occurred during the life cycles of the respective REITs.
Blue Vault subscribers may log in to access the Full-Cycle Study in The Vault. If you are not a subscriber, click here for our store.
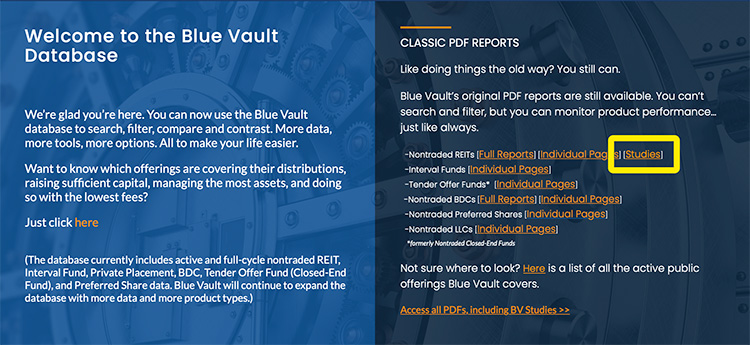
The Link to the PDF versions of Blue Vault’s nontraded REIT studies, is indicated in the image below.