How Cash Ratios Are Trending for NTRs
June 22, 2023 | James Sprow | Blue Vault
A recent article on S&P Capital IQ stated that the cash ratios of non-investment grade-rated companies were “squeezed further” in the first quarter of 2023. The article used the median measure of cash and equivalents as a share of total liabilities of companies rated lower than BBB- by S&P Global Ratings which fell to 36.3% in the first quarter from 40.1% at the end of 2022. In this article, we look at two ratios for all nontraded REITs that were active from Q1 2020 thru Q4 2022. We plot the median ratios for cash to total assets and cash to total debt.
We find that the story line is similar for the nontraded REIT sector. Even though we use two different ratios than the S&P Global report, the overall trend is unmistakable. (Our database has metrics for total assets and total debt rather than total liabilities. Total debt excludes short-term liabilities such as accounts payable.) From Q1 2020 to Q4 2022, the median ratio of cash and equivalents to total assets for all NTRs fell from 4.43% to 2.56%. (Chart I) The median ratio of cash and equivalents to total debt fell from 7.54% for all NTRs in Q1 2020 to 5.08% in Q4 2022. (Chart II)
Chart I
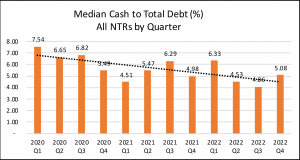
Chart II
Cash held by nontraded REITs is used for paying interest on debt, paying distribution to common shareholders and preferred shareholders, repurchasing outstanding shares, and making acquisitions. A REIT’s Statement of Cash Flows shows the sources of cash, typically from operations, capital raised via open offerings and distribution reinvestment, and financing such as mortgages and lines of credit. When a nontraded REIT’s liquidity as measured by cash on hand is reduced, managers may be faced with decisions to reduce distributions to shareholders, cap share repurchases, dispose of properties and/or other cash-preserving strategies.
Regarding the S&P Global report, the cash ratio used in that report measures the ability of companies to cover the short-term obligations on their debt using cash and cash equivalents. The median ratio for companies covered by S&P’s Ratings has been steadily declining since the second quarter of 2020, when companies undertook a dash for cash to bolster balance sheets during a global pandemic.
The median measure of cash and equivalents as a share of total liabilities of companies rated lower than BBB- by S&P Global Ratings fell to 36.3% in the first quarter, from 40.1% at the end of 2022, with declines in seven of the 11 sectors, according to the latest S&P Global Market Intelligence data.
Trends in the Real Estate Sector in the S&P Global Report
Among non-investment grade companies, the steepest decline in Q1 2023 was in the real estate sector to 67.1% from 78.4% at the end of 2022. Yet that remains significantly higher than in other sectors that saw declines, such as consumer discretionary and financials.
For investment-grade companies, the ratio rose in seven of the 11 S&P 500 sectors, with a particularly strong rebound in investment technology to 44.4% from 39.1% and utilities, up to an eight-quarter high of 5.1% from 3.4%.
By contrast, the median ratio for companies rated BBB- and higher in the communication services sector fell to 22.9% from 28.5% in Q1 2023.
Sources:
Blue Vault Database; S&P Global