What Happens After a DST Closes?
Most DST research starts with the offering.
Distribution rate, cap rate, leverage, property type and projected return all matter. But those figures describe what is expected at the outset.
Blue Vault is building a broader view of the DST market—one that looks at both today’s opportunities and what ultimately happened after prior DSTs closed.
That means advisors can compare current offerings across standardized metrics while also examining closed and full-cycle results for additional historical context.
Start With Today’s DST Market
Current DST offerings can look similar at first glance while differing considerably beneath the surface.
Among open DST offerings currently tracked by Blue Vault, distribution rates extend from the low-4% range to approximately 7%.
Distribution rate is only one piece of the comparison. Blue Vault also tracks current DST offerings across metrics such as:
- Investor cap rates
- Leverage and LTV
- DSCR
- Occupancy
- Equity available and remaining
- Fees
- Debt terms
- Property type
- Exit structure
Standardizing those metrics gives advisors a better way to compare the market and narrow the field.
But the Offering Is Only the Beginning
Blue Vault’s DST research does not stop once an offering is fully subscribed.
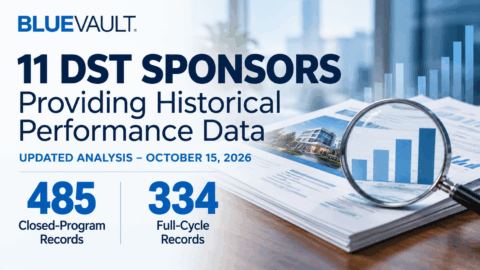
Our historical database currently includes 281 full-cycle DST records, allowing Blue Vault to examine what happened after the initial projections were made.
That opens the door to a different set of questions:
Did distributions perform as expected? How long was the investment held? What happened at disposition? What returns were ultimately realized? And how consistent were outcomes across a sponsor’s historical programs?
That historical perspective can reveal differences that are difficult to see when evaluating one DST at a time.
Consistency Can Matter as Much as the Average
Historical DST performance is rarely as simple as identifying a “good” or “bad” sponsor. Some sponsors have demonstrated considerable consistency across the full-cycle programs currently captured by Blue Vault, while others have experienced a wider range of outcomes—including both strong-performing DSTs and programs that faced meaningful performance challenges.
One sponsor currently stands out.
ExchangeRight stands out in Blue Vault’s full-cycle dataset for the consistency of its tracked historical outcomes across several of the performance measures Blue Vault follows.
Under Blue Vault’s sales-price measure, 100% of ExchangeRight’s tracked full-cycle records are currently classified as performing.
That level of consistency is not universal. At the same time, sponsors with a higher incidence of challenged programs have also produced successful—and in some cases very strong—DST outcomes.
That is why looking at the range and consistency of historical results can be more useful than relying on a single program or sponsor-level average.
One DST Doesn’t Define a Sponsor
A single successful DST does not establish a sponsor’s historical consistency. Likewise, one challenged program does not establish poor sponsor performance.
Looking across a broader history can help advisors ask more meaningful questions:
- Were projected distributions maintained?
- How widely did realized results vary?
- How frequently did disposition values support the original investment basis?
- Were stronger results broadly distributed or concentrated among a smaller number of programs?
- How did outcomes vary across property types, vintages and market environments?
Those are the kinds of questions standardized historical DST data can help advisors explore.
For Advisors: Find. Compare. Then Dig Deeper.
Blue Vault isn’t only a place to research a DST after it reaches your desk.
Whether you are evaluating a specific opportunity or trying to narrow the DST universe, Blue Vault gives advisors a standardized way to compare today’s offerings and then add historical sponsor and program context.
Use Blue Vault to help find your DST.
Already have Blue Vault access?
Log in to explore current DST offerings, standardized metrics, sponsor history and full-cycle outcomes.
Not yet subscribed?
Financial advisors can access Blue Vault at no cost.
Source & Methodology
Blue Vault DST data is compiled exclusively from sponsor-issued source materials available to Blue Vault, including offering documents, closing information, disposition materials and other sponsor-provided reporting. Blue Vault does not independently audit sponsor-reported information.
Although Blue Vault applies review and quality-control procedures in compiling and standardizing the data, information may be incomplete, subsequently revised, interpreted differently, or subject to errors in sponsor reporting, transcription, processing or data entry.
Historical comparisons reflect information available to Blue Vault and may not represent every DST program completed by a sponsor. The number of observations, investment periods, property types, market environments and other characteristics may differ materially among sponsors. Sponsor-level results therefore should not be interpreted as controlled or equivalent comparisons.
Historical performance is provided for informational purposes only and is not indicative of future results. Blue Vault does not provide investment advice.
Information is intended only for institutional, broker dealer or registered investment adviser use. This information is prohibited for use by the general public. Past performance is not indicative of future results.