A Curious Look at Commercial Real Estate Cap Rates
August 30, 2023 | James Sprow | Blue Vault
In this article we ask the question, “Which came first, the market value or the cap rate? Does that question sound familiar? It should, since it really is like the classic “chicken or egg” conundrum. The fact is cap rates do not determine market values and market values do not determine cap rates. But, each determines the other. Confusing, isn’t it?
What’s a Cap Rate Anyway?
The capitalization rate (cap rate) is one metric that’s very important to real estate investors and it can be used to compare the values of properties and as a quick way to estimate an expected rate of return. Starting with a definition, we see it couldn’t be any simpler. As formulas go, no formula is a formula unless it has at least three variables, and the cap rate formula has the bare minimum:
Cap Rate = Net Operating Income (NOI) ∕ Current Market Value
So, in this formula, we have two observables and one “implied.” That is, we can find a net operating income from the financials for a specific property or a portfolio of properties. We can find the current market values from appraisals for a specific property or a net asset value for a portfolio of properties. Then, using values for these two observables, we can infer or imply, that is, “solve for”, the cap rate.
What Does a Cap Rate Tell Us?
The first question we need to ask is “Where do you get the NOI?” At the property level, an NOI is simply the rental revenue at current rents less the property-related expenses. Notice the term “current.” The cap rate calculation is going to assume that the current NOI continues indefinitely, since the value of a property or portfolio of properties is all about the cash flows it generates. Should we assume those cash flows will continue indefinitely? Probably not, which means we are solving for a “current cap rate.”
If we’re solving for the cap rate, using the current market value as determined by appraisals or recent sales and purchases offers a simple reference point. If we have that value and have made some simplifying assumption about NOI, the cap rate is easy to calculate.
Why Would Cap Rates Differ?
Obviously, different properties and portfolios offer different solutions to the simple cap rate formula. For example, what factors make the cap rates for hospitality assets differ from the cap rates for industrial or multifamily assets?
For starters, assuming that the net operating income will remain constant over time would seem extremely unrealistic. So, we could say that the cap rate we solve for is only determined by the current property value’s most recent net operating income. It tells us little to nothing about what the relationship of NOI to property value will be in the future. Other things equal, if NOI is expected to grow, we could say that the cap rate is expected to fall. If NOI is anticipated to fall, the cap rate should be expected to rise. Simply put, if today’s cap rate estimates include some assumptions about future changes in NOI, comparing cap rates across property types might reveal expectations about future NOI.
What about risk? If the changes in future NOI relative to recent NOI are unknown, and the volatility of NOI changes are important, then, other things equal, that risk should influence the cap rate. But how? We know that investors require higher rates of return when assuming higher risk, and if cap rates offer insights into expected rates of return, then we would expect higher cap rates to be associated with higher risk. But, how would that come about? Quite simply, the riskier the future cash flows, the lower the property value, and a lower property value would lead to a higher cap rate.
Cap rates will also differ as required rates of return in any particular market change. A major influence on required rates of return across all markets is the current market interest rate. Whether we look at short-term rates or longer-term rates, higher interest rates will lead investors to higher required rates of return. A classic formula for a required rate of return is: Rr = Rf + risk premium.
That simple formula states that an investor’s required rate of return is determined by the risk-free rate (Rf) plus an additional premium for assuming the risk of a particular investment. In the case of cap rates, the risk premium will be built into the calculation as riskier assets will have lower market values than less risky assets. But, every cap rate will contain a component of the risk-free rate. We could say: cap rate = Rf + risk premium. In other words, every cap rate should rise when interest rates rise and rise when perceived risk rises. Interest rates will influence all cap rates equally, but risk will impact cap rates differently for every asset.
To see the relationship between historical cap rates and interest rates, the following chart will be useful. In this chart, the risk-free rate can be represented by the yields on 10-Year Treasury bonds. A proxy for risk is the yield on BBB corporate bonds, which will mirror the economy-wide perception of risk. (More accurately, the difference between the 10-Year Treasury yield and the BBB bond yield can model the risk premium.)
Bond Yield and All Property Average Cap Rates
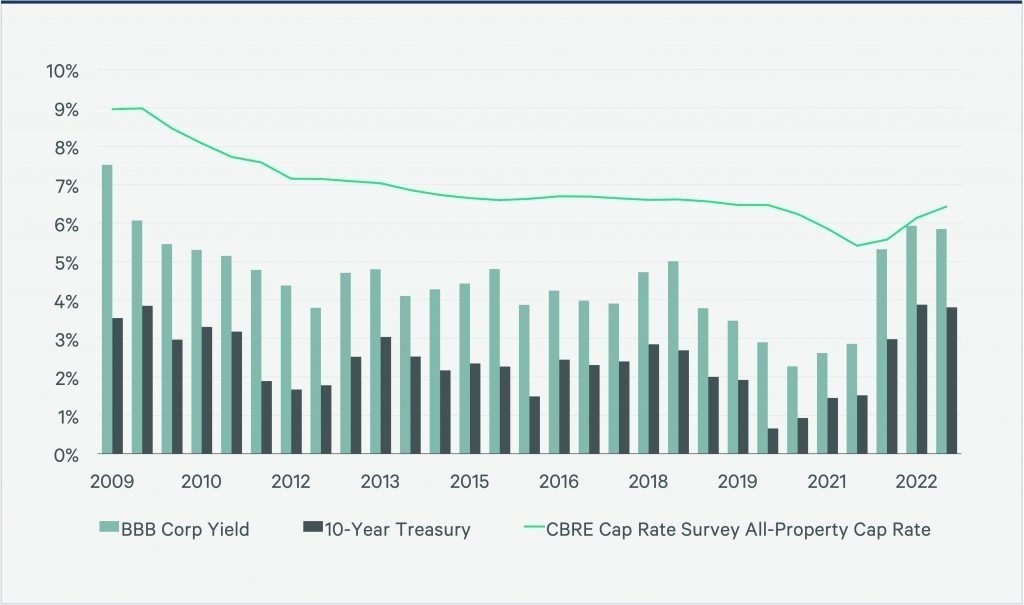
This chart shows that, as 10-Year Treasury yields have varied over the last 13 years, all property average cap rates have been descending, until quite recently. With the sharp rise in interest rates since 2020, cap rates have also risen. Likewise, with the risk premiums illustrated by the margins between the BBB corporate bond yield and the 10-Year Treasury yield, cap rates have been influenced. As the margins grew in 2022, cap rates rose. Looking at the chart, we also notice that there is an apparent lag between the rise in interest rates and bond yields and the rise in cap rates. One explanation might be that cap rates are estimated by historical NOI, which means there is a built-in time lag between reported NOI and more current interest rates.
Cap Rates Across Different Asset Types
As stated above, we would expect cap rates to differ across different properties or portfolios of properties due to differences in both the expected changes in NOI and the riskiness of those changes. In other words, other things equal, the higher the expected growth in NOI, the lower the cap rate, and the higher the perceived riskiness of those changes in NOI, the higher the cap rate. So, across different asset types, there will be a common influence on cap rates depending on the market’s perception of those expected growth rates in ROI and the perception of the potential risk.
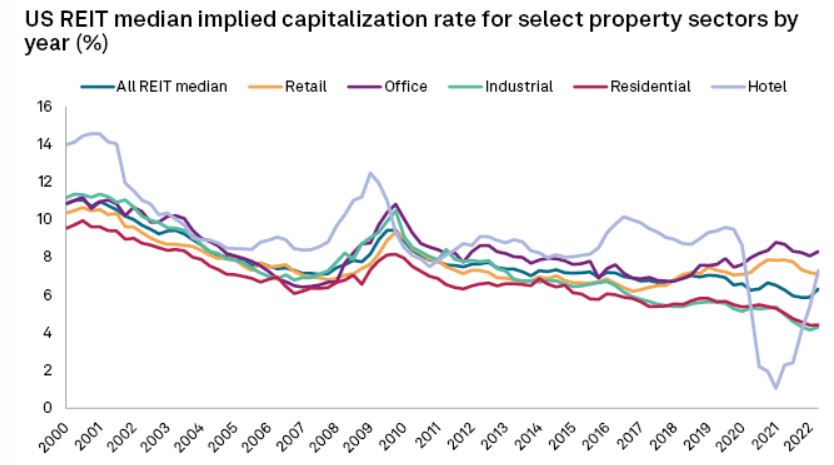
This chart from S&P Global Market Intelligence illustrates the differences in median cap rates across major sectors of the commercial real estate market. These medians represent the mid-points of cap rates and confirm that, over time, the influences that we describe do cause cap rates to differ as the projected growth rates, riskiness and market interest rates all combine to provide differences across the asset types of commercial real estate.
Historically, cap rates for residential real estate properties have been lower and less volatile than those of hotels, for example. Residential real estate has been less subject to the ups and downs of the economy, while hotels and the hospitality sector has been much more impacted by economic trends.
Conclusions
Cap rates can be thought of as both the result of market values and a determinant of market values. They are useful in comparing values and estimating values. In simple terms, they are one measure of the combined effects of growth projections, risk assessments and market interest rates.
Implied cap rates can be estimated from current net operating income and market values, but there are potential lags involved and required estimates of future growth. The changes in market interest rates and cap rate estimates reveal that lags are present.
Different asset types will have different median cap rates, and observing cap rates over time reveals how different asset types have different NOI growth estimates, risk estimates and volatility.
Sources
S&P Global Market Intelligence; CBRE