
A Look at FS Investments Nontraded BDCs and Interval Funds

August 13, 2019 | James Sprow | Blue Vault
FS Investments started as Franklin Square Capital Partners in 2007. The firm currently has in excess of $23 billion in assets under management in 11 funds, with 300 colleagues nationwide. FS launched their first nontraded BDC with FS Investment Corporation (“FSIC”) and introduced the first energy-focused BDC, FS Energy & Power Fund in 2011. FS Global Credit Opportunities was their first nontraded closed-end fund in 2013. FSIC listed on the NYSE in 2014. FS Energy Total Return Fund was launched in 2017 in partnership with Magnetar Asset Management. FS Multi-Strategy Alternatives Fund launched in 2017 in partnership with Wilshire Associates Incorporated. FS Credit Real Estate Income Trust was launched in 2017 with Rialto Capital Management. In 2017, the firm also launched FS Credit Income Fund with GoldenTree Asset Management.
The four public BDC funds managed by FS Investments are shown below.
BDCs
Table I
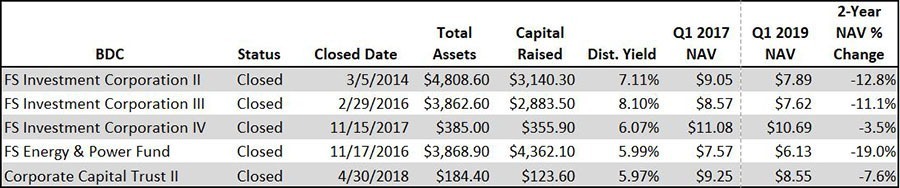
Corporate Capital Trust II was formerly advised by CNL Fund Advisors from its inception in March 2016 until April 2018 when it entered into a new investment advisory agreement with FS/KKR Advisor, LLC.
BDC Merger and Listing Plans
FSII, FSIII, FSIV, and CCTII entered a plan of merger on May 31, 2019. The merger terms have FSIC II as the surviving company, and each of the merging company shareholders will receive FSIC II common stock in an exchange ratio equal to the net asset values per share of the respective company shares divided by the net asset value per share of FSIC II common stock. They will become a publicly traded BDC. The merger is expected to close in Q4 2019.
Beginning with the closed nontraded BDCs, what factors have impacted the funds to result in such negative performance? Why has each fund experienced a drop in the NAV since Q1 2017?
Looking at their Statements of Changes in Net Assets, the drops appear to be coming primarily from unrealized depreciation on investments, but also slightly from realized losses on investments. Net investment income has been dropping somewhat, but that’s to be expected with a maturing portfolio with loans being paid back. Also, there is quite a bit of overlap regarding companies the BDCs are investing in, so if the value of one investment drops, it impacts every fund.
Q4 2018 was not a good quarter for these BDCs. Their NAVs dropped along with the stock market. In the table below, however, year-over-year comparisons between Q4 2018 and Q1 2019 reveal a more optimistic story.
Table II
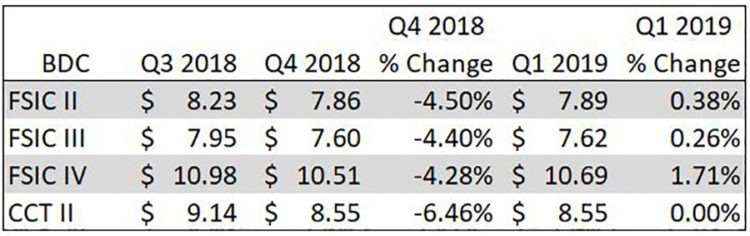
The steep drops in NAVs from Q3 2018 to Q4 2018 were mirroring the results in the broader equity markets. The S&P 500 ended Q3 2018 at 2,913.98. At December 31, 2018, it was at 2,506.85, a drop of almost 14%. That drop puts the decreases in the FS BDC NAVs in perspective.
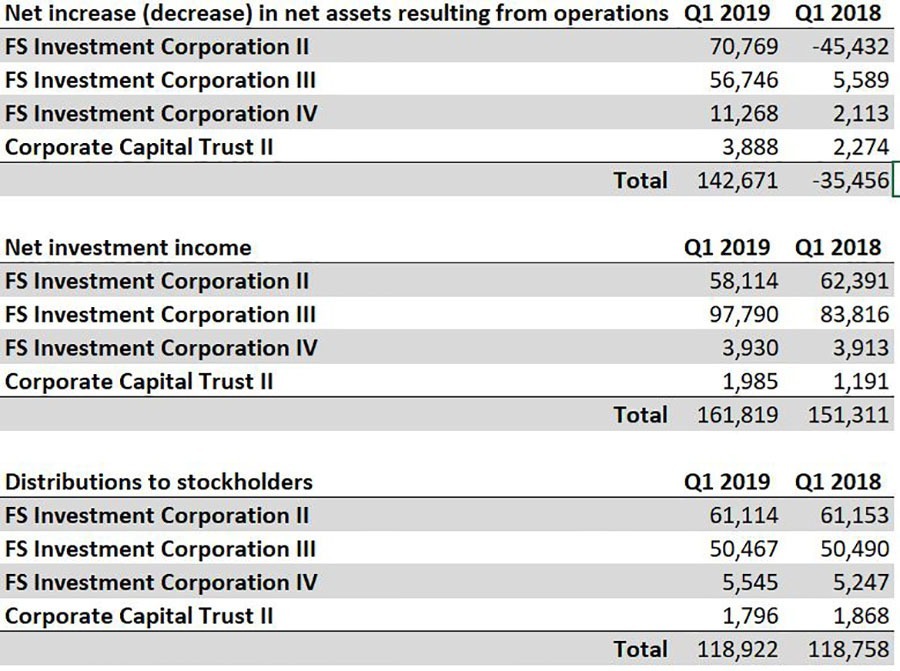
In the next table (Table III), we compare the quarterly operating results for the four individual FS BDCs and for the group for Q1 2019 vs. the year earlier Q1 2018. For the most part, the improvements in operating results and distribution coverage are clear.
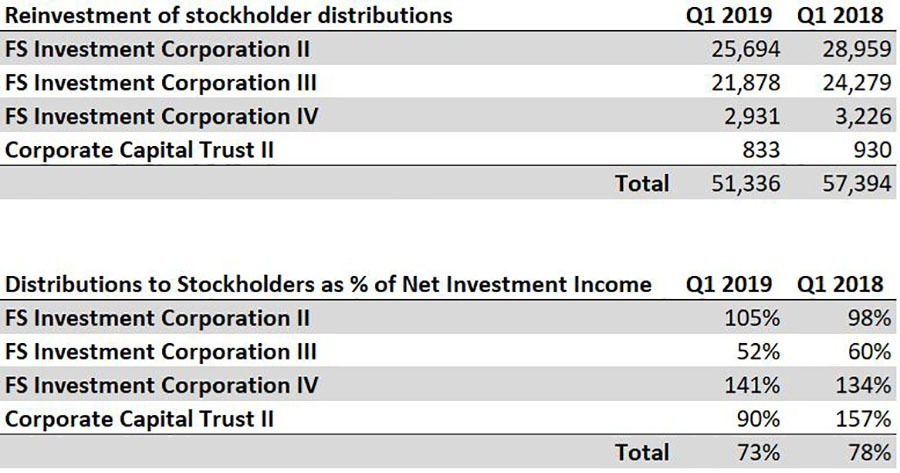
A key ratio in the tables is the ratio of distributions to shareholders as a percentage of net investment income. Two of the funds show lower ratios of total distributions to net investment income while two show increases in that ratio. For the four funds, the ratio shows a decrease, owing in large part to the share of net investment income from FSIC III and its low ratio of distributions to net investment income.
The proposed merger, if approved, and the subsequent listing of the combined BDC may result in increased values for the four BDC shareholders, based upon the combined operating results of the BDCs, and any operating economies that may result from the merger. However, the most recent ratio of listed BDC pricing to NAV reveals a median discount of 12% and an average discount for 44 listed BDCs of 9%. Unless the merged BDC is viewed more favorably by the market when it lists in Q4 2019, shareholders may see a valuation that is below the reported NAVs of the four currently-nontraded BDCs.
Table III
FS Interval Funds
As of June 30, 2019, FS Investments has two Interval Funds raising equity that are open to new investors via public offerings. They are FS Credit Income Fund and FS Energy Total Return Fund. A third interval fund, FS Multi-Alternative Income Fund is open but is not publicly offered.
Table IV
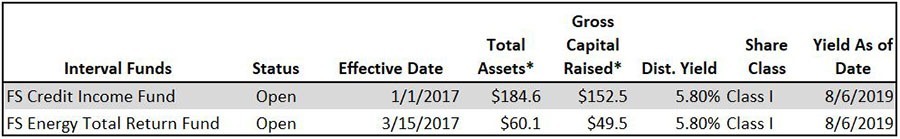
*As of April 30, 2019
In a Post-Effective Amendment filed on July 16, 2019, FS Credit Income Fund updated its Prospectus for a continuous offering of up to $2 billion in five share classes, all priced at the current NAV plus applicable sales loads. The fund’s initial public offering was declared effective in January 2017 and as of April 30, 2019, had raised $152.5 million. It has a strategy of investing at least 80% of its assets in debt obligations. The securities acquired by the Fund are across a broad spectrum.
FS Energy Total Return Fund was declared effective in March 2017. As of April 30, 2019, the fund had raised just $49.5 million in its continuous offering. The Fund’s objective is to generate attractive total return consisting of current income and capital appreciation. It invests primarily in the equity and debt securities of natural resource companies, including those engaged in developing energy infrastructure and the acquisition, exploration, production, mining, processing, refining, transportation, storage, servicing and marketing of natural resources, including all forms of petroleum, coal, and renewable energy sources, as well as companies that provide equipment and services to companies engaged in the energy sector.
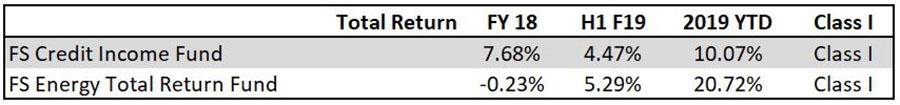
The total returns for the two Interval Funds for fiscal 2018, the first half of fiscal 2019, and the six months ended June 30, 2019, are shown in Table V.
Table V
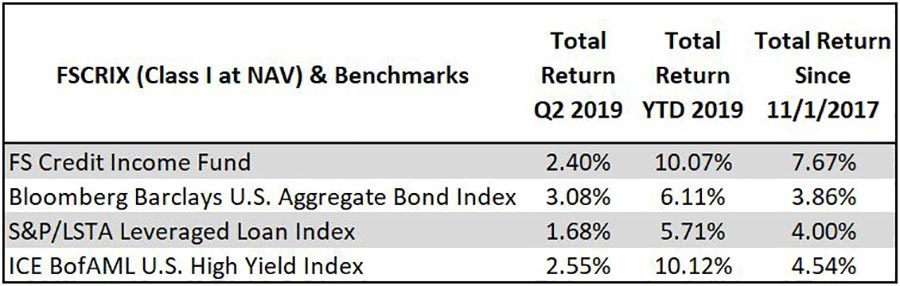
Several comparison benchmarks for FS Credit Income Fund are the returns on other bond and loan indices. These comparisons are shown in Table VI.
Table VI
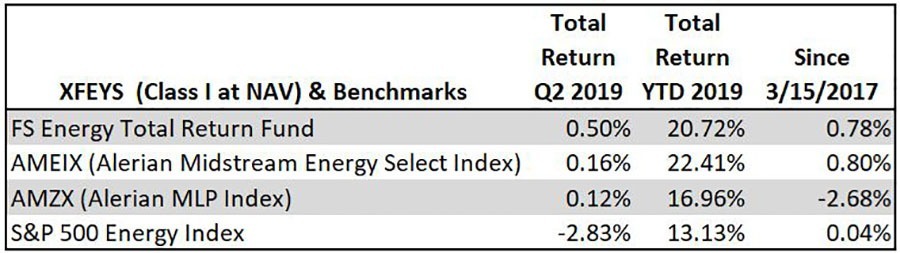
Benchmark comparisons for FS Energy Total Return Fund as of June 30, 2019, are in Table VII.
Table VII
Risk metrics for the two Interval Funds for the trailing 12-month period ended April 30, 2019, are shown in Table VIII.
Table VIII
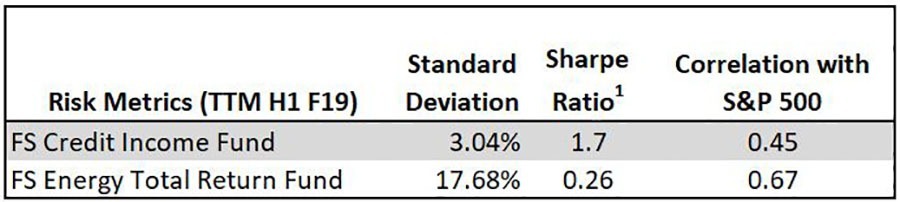
In relation to all 32 Interval Funds3 currently covered by Blue Vault in its semi-annual reports, the FS Interval Funds rank 9th and 15th in Sharpe Ratio for the trailing 12-month period ended April 30, 2019. The median Sharpe Ratio for the 32 Interval Funds for the period was 0.2.
The performance of these Interval Funds for Class I shareholders with no loads appear to be favorable when compared to their selected benchmarks. However, the sales loads for Class A and Class T shares would severely impact the holding period returns for those shareholders and drop those returns adjusted for the loads below the returns of their respective benchmarks. Over longer holding periods, the effects of the loads become less impactful on total returns.
Footnotes:
1. Sharpe Ratio: Measurement of the risk-adjusted performance. The annualized Sharpe Ratio is calculated by subtracting the annualized risk-free rate (yield on the 3-month Treasury Bill) from the annualized rate of return for a portfolio and dividing the result by the standard deviation of the portfolio returns.
2. On July 11, 2019, Grace Hutchinson resigned from her positions with FS Investments and its affiliates, including her role as a member of FS Credit Income Advisor’s investment committee. On July 18, 2019, Brian Norcross was appointed as a member of FS Credit Income Advisor’s investment committee.
3. Blue Vault produces semi-annual reports on all active Interval Funds with more than $50 million in net assets and at least one fiscal year of operations.
4. Class I shares are not subject to a sales load. Class A shares have a maximum sales load of 5.75% and Class T shares have a maximum sales load of 3.50%.
5. Class I shares are not subject to a sales load. Class A shares have a maximum sales load of 5.75% and Class T shares have a maximum sales load of 3.50%.