James Sprow | Blue Vault
While the data available to analyze where nontraded REITs are investing is incomplete, we still can get an idea of the type of properties the current active nontraded REITs have in their portfolios and where those properties are located. One of the most important limitations in collecting portfolio data is the fact that nontraded REITs often report a “property” that is a portfolio of properties.
For example, the largest nontraded REIT, Blackstone Real Estate Income Trust, lists a property investment in a “Rental Housing” company, Home Partners of America, with 28,490 rental units, spread across forty metro areas. In the REIT’s latest quarterly filing, the investment is listed as a single line item. Many nontraded REITs acquire portfolios of properties and don’t report details such as where the individual properties are located.
Blackstone REIT’s industrial property investments span no fewer than 3,215 individual properties, and more than a few portfolios are held in joint ventures with less than 50% ownership by the REIT. Its data center investments included 97 properties held in five portfolios as of Q3 2023. Two of the investments were in joint ventures with less than 50% ownership interests.
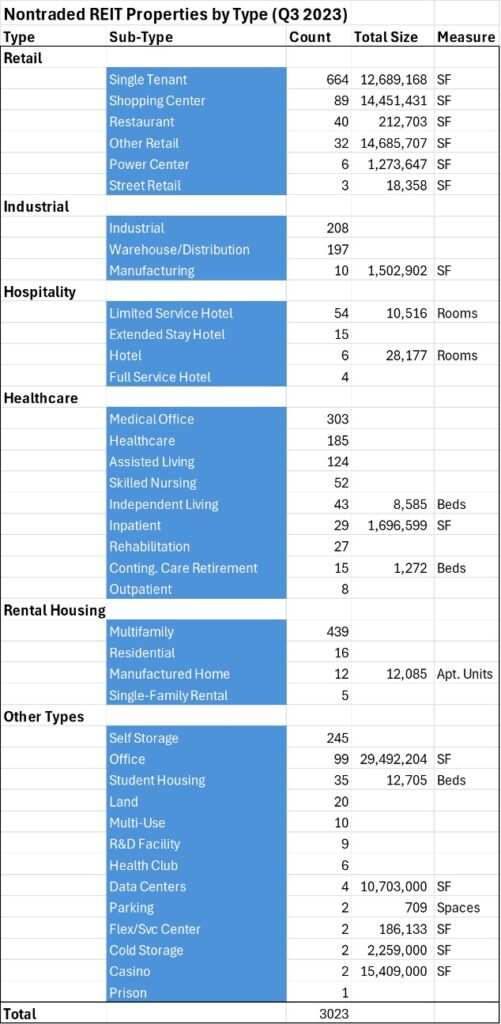
Despite the limitations created by the way nontraded REITs report their property holdings, we can illustrate the diversity of those portfolios by summarizing what we do know in the following table. We have data for over 3,000 properties that feature some details about both the types of properties and their locations. Unfortunately, in cases where a portfolio’s properties are spread across the U.S., we don’t have the level of detail we would like.
Some property types are interestingly similar. For example, one REIT may describe its investments as “Healthcare” related, while another may report its investments broken out by “Medical Office Buildings,” or “Outpatient.” Industrial properties may be simply classified as “Industrial” or more specifically as “Warehouse/Distribution.” As we’ve seen in the case of Blackstone REIT, single-family rental properties may be reported only as a single portfolio but can contain thousands of individual units.
Where some metrics are available, such as square footage and rooms, we can report those figures only as they are available in quarterly reports. For more detailed property breakouts, the REITs’ 10-K annual reports usually provide more information, and the REIT websites provide pie charts with percentages of the REIT’s portfolio invested in diverse types calculated based upon fair values rather than simple counts.

NTR Properties by State
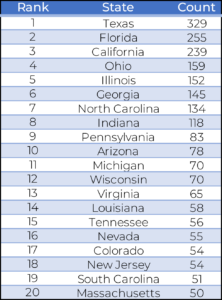
Looking at where in the U.S. nontraded REITs own properties, we may be surprised that there may not be a strong correlation between the populations of different states and the number of NTR investments in those states. For example, New York ranks as one of the most populous states, but in terms of property counts in the nontraded REIT portfolios, New York ranks 27th. Many REIT strategies explicitly state that they are targeting investments in the Southeast and Southwest U.S, and that appears to be supported by the large property counts in Texas, Florida, Georgia, North Carolina, and Arizona.
Many property portfolios are reported as “NA” because the properties within the portfolio are spread across multiple locations.

Sources: Blue Vault, S&P Global


