Are your clients asking how the presidential election could affect their investments?
Every four years, speculation about the incoming president and their policies heightens uncertainty for both advisors and their clients. This time around is no exception, given the 2024 election will likely feature a unique rematch of the last two presidents.
YCharts’ latest guide, How Do Presidential Elections Impact The Market? answers the most commonly asked questions that financial advisors hear from clients during an election year.
Below are a few of the key takeaways. Download the guide to access the full analysis along with downloadable visuals to share with clients.
Markets Rose Following the Last Two Elections
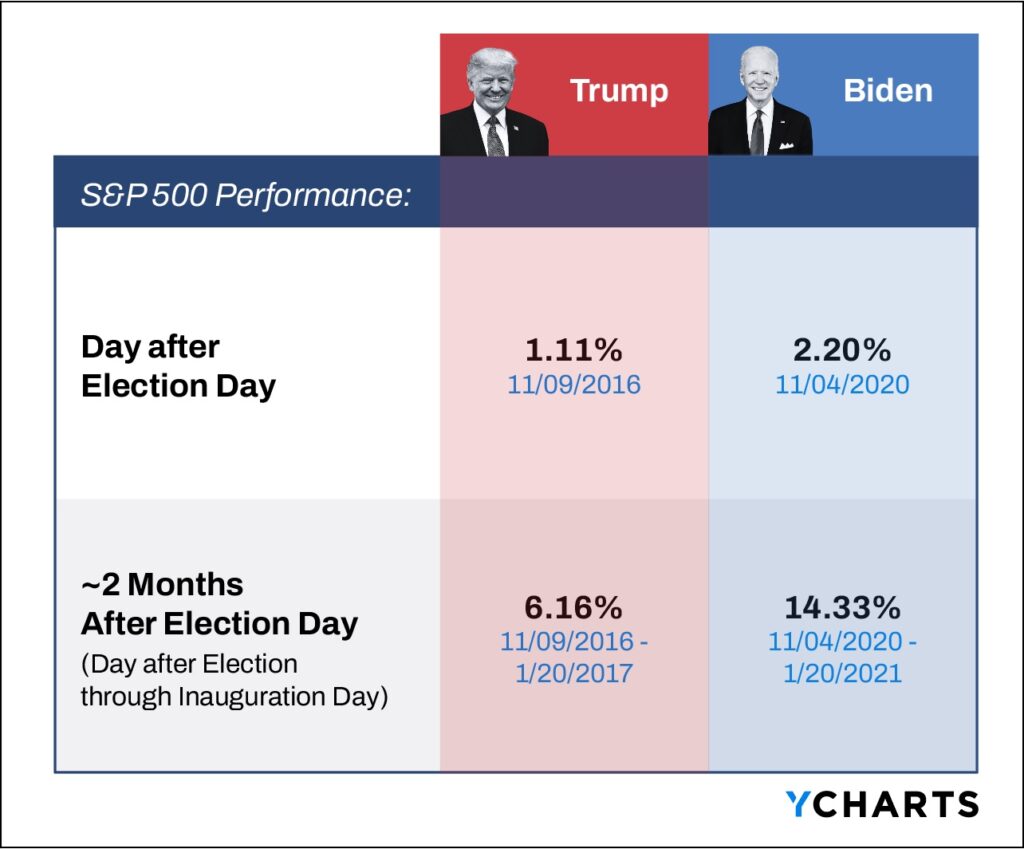
The 2024 election is a rematch of the last two presidents. How did markets react to the 2016 election vs. the 2020 election?
Markets greeted the prospects of a Biden presidency in 2020 with more enthusiasm than they did Trump’s electoral victory in 2016. The S&P 500 rose 2.20% the day after Election Day in 2020, which was double its post-2016 Election Day performance.
However, the post-election period was generally positive for equities following the last two elections, as the S&P 500 rose the day after each election through inauguration day.
Divided Congresses Produced Greater Returns
Historically, higher average annualized returns have occurred during a divided Congress, where one party controls the House or Senate and the other party holds a majority in the second chamber. Lower returns have come during Democratic majorities in both the House and Senate, while higher returns have taken place under Republican control of both congressional chambers.
In any case, the market has historically been positive under all six government compositions, as seen in the visual below.
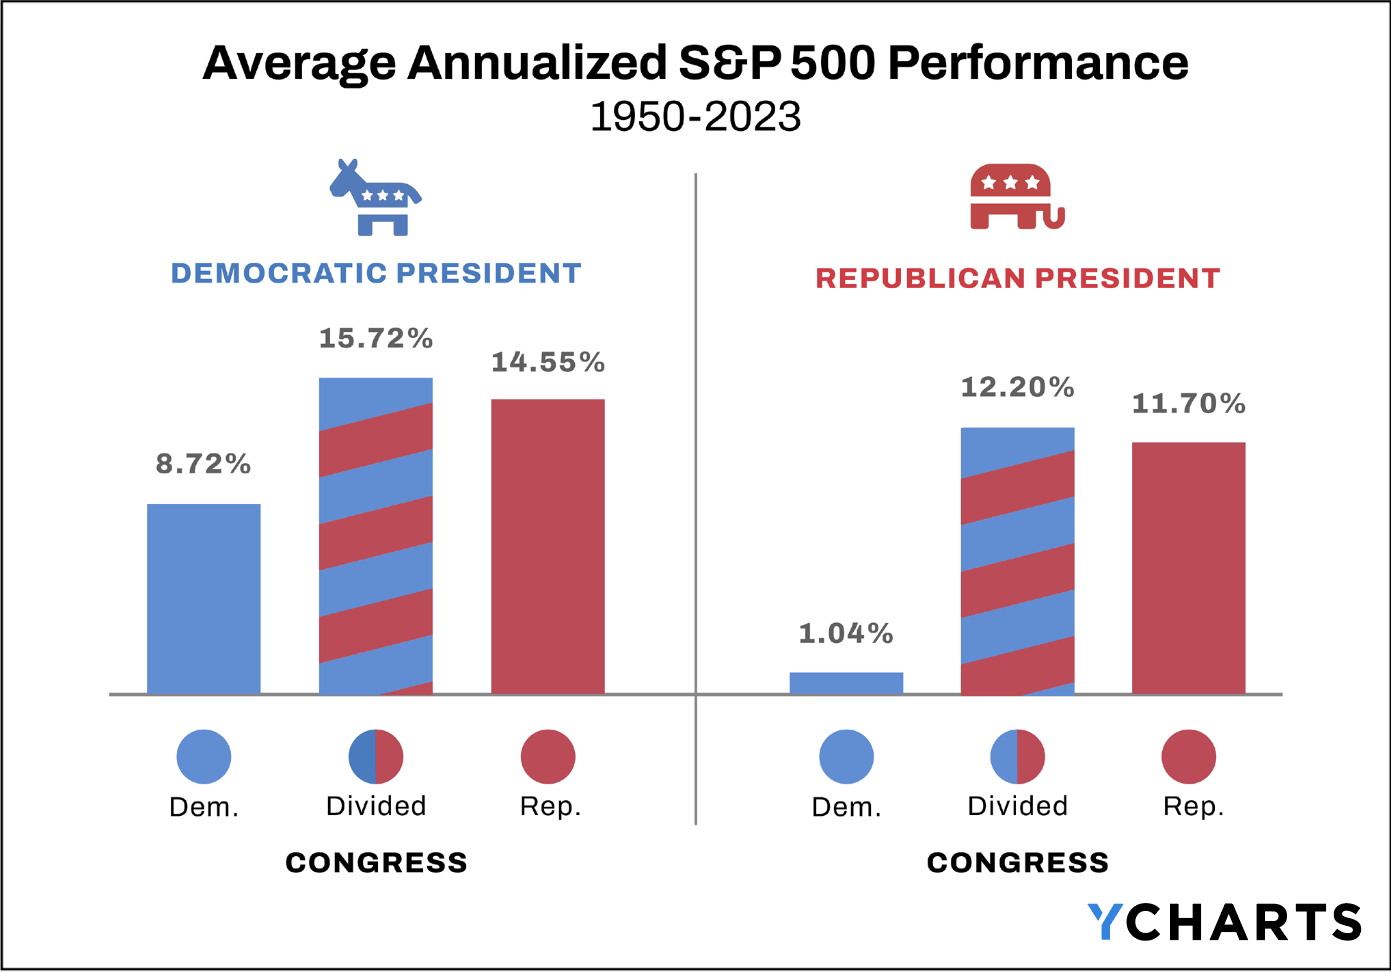
Under the current government of a Democratic president and a divided Congress, the S&P 500 has advanced 36.85% (28.69% annualized) between January 3rd, 2023–when this current Congress was sworn in–and March 31st, 2024, outperforming the 15.72% annualized return historically generated during this legislative formation.
Staying Invested is the Most Prudent Long-Term Strategy
Making major investment decisions based on a president’s political party–i.e. being invested only during Democratic presidencies, then moving to cash for Republican tenures, or vice versa–is probably hurting your portfolio more than helping it.
Using the S&P 500 as a benchmark, choosing to invest only during Democratic presidencies since 1950 and sticking to cash otherwise resulted in a 5.11% annualized return. Similarly, a strategy of investing exclusively during Republican presidencies generated an even smaller 2.80% annualized return.
Whereas, simply “staying the course” produced the best result.
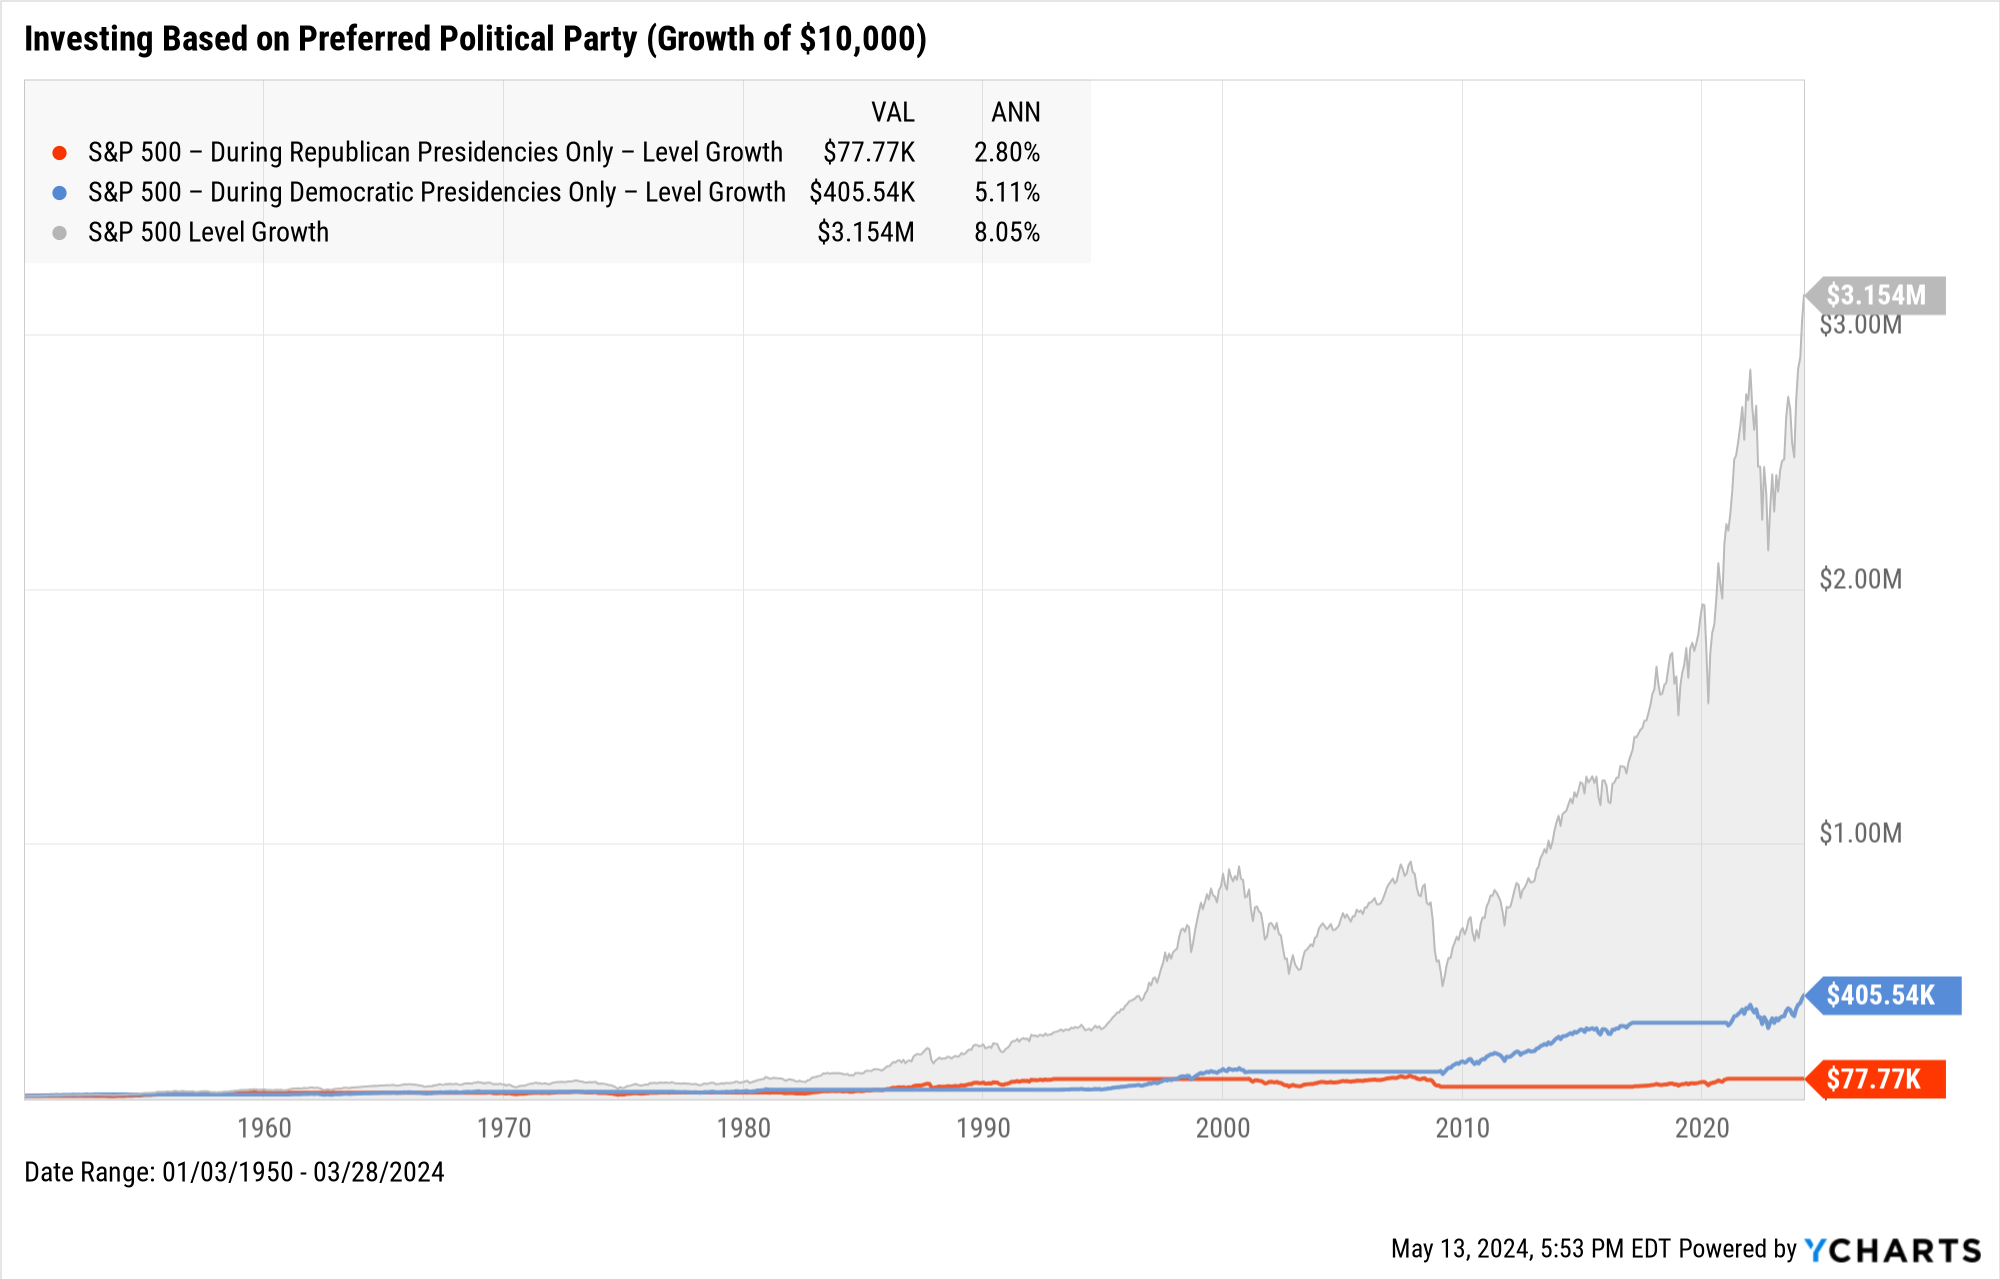
Though there have been several peaks and valleys along the way, the S&P 500 has grown in value over the long term regardless of who’s in office.
While elections may create some short-term uncertainty, advisors can arm themselves with key information–such as the fact that markets have risen following the past two election cycles–to quell client concerns.
No matter the circumstance, focusing on long-term investing goals should always be the most important factor in investment decision-making for advisors and their clients.
Whenever you’re ready, there are 3 ways YCharts can help you:
1. Interested in creating your own election material for clients?
Send us an email at hello@ycharts.com or call (866) 965-7552. You’ll be directly in touch with one of our Chicago-based team members.
2. Want to test out YCharts for free?
Start a no-risk 7-Day Free Trial.
3. Download our election guide, How Do Presidential Elections Impact the Market?
This content was provided by YCharts.