Are Interval Funds Performing?
July 26, 2019 | James Sprow | Blue Vault
Interval Funds offer investors the ability to invest in private and illiquid securities, such as direct lending to medium-sized businesses, institutional commercial real estate funds, real estate-related debt, private equity, insurance-related securities and a wide variety of other asset types. They offer pricing transparency with daily NAV updates for share sales and redemptions, continuous offerings, periodic liquidity via quarterly redemptions of up to 5% of outstanding shares, and low investment minimums.
With all the features that Interval Funds offer, there are reporting issues that make apples-to-apples comparisons of Interval Fund performance difficult. These are:
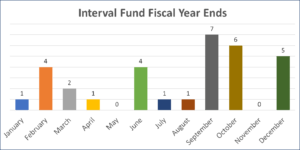
• Different fiscal years (up to 10 different fiscal year-ends for 30 Interval Funds)
• Semi-annual reporting rather than the quarterly SEC financial filings of other alternative types
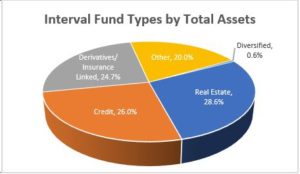
• Different investment strategies and asset types and differing objectives


Blue Vault covers 32 Interval Funds in our semi-annual reports. This coverage constitutes 95.9% of the total assets held by Interval Funds and 95.6% of the net offering proceeds raised by these funds in 2018.
Total Assets in Interval Funds as of December 31, 2018, was $33.53 billion, and Net Assets (which corresponds to Equity) totaled $28.00 billion. In just five years, capital raised by Interval Funds has increased from $1.64 billion in 2014 to $7.56 billion in 2018, eclipsing the capital raised by NTRs in 2018 of $4.74 billion and nontraded BDCs of $0.51 billion.
Due to the differing fiscal years and semi-annual reporting by Interval Funds, comparisons of six-month total returns are problematic. In the most recent reporting periods, the median distribution yield of Interval Funds in Blue Vault’s reports was 5.49%.
Due to the daily NAV pricing provided by Interval Funds, the standard deviations of total returns, using changes NAVs with distributions added back to arrive at a daily total return, can be calculated, as well as Sharpe Ratios, which measure risk-adjusted returns. The standard deviations measure how much the NAVs of the funds vary around their averages over a given time period (one year in Blue Vault’s reports). Lower standard deviations show lower volatility of returns. Sharpe Ratios reported by Blue Vault measure the total returns less the return on Treasury bonds over a 12-month period, relative to the standard deviations of those returns. Higher Sharpe Ratios show a better risk vs. return trade-off. Blue Vault also reports the correlation of Interval Fund returns to the S&P 500 total returns for the trailing 12-month period. Alternative investments such as Interval Funds offer risk-adjusted returns and low correlations with the stock market, making them a good investment to reduce risk in a well-diversified portfolio. All but two of the Interval Funds covered by Blue Vault for the 12-months ended April 30, 2019, had lower standard deviations than the S&P 500, and over 60% of the funds had positive Sharpe Ratios over that same period.
Sources: Blue Vault, SEC


