
Breaking Down Alternative Investment Sales
May 7, 2019 | James Sprow | Blue Vault
Nontraded REITs Sales as of March 31, 2019
Sales by reporting nontraded REITs during Q1 2019 totaled an estimated $1.712 billion, including $1.129 billion in sales by Blackstone REIT. The total did not include sales by Starwood REIT which broke escrow on December 21, 2018, with $165 million in sales. The Q1 2019 total was up about 47% compared to Q4 2018 sales of $951.6 million. First quarter 2019 sales were up 47% compared to the average quarterly raise in 2018 of $1.164 billion, and 60% above the average quarterly totals for 2017 of $1.073 billion. There were 25 nontraded REITs raising capital during Q1 2019, the same number of NTRs raising capital in Q4 2018, and as of April 2019, there were 23 nontraded REITs raising capital through effective public offerings.
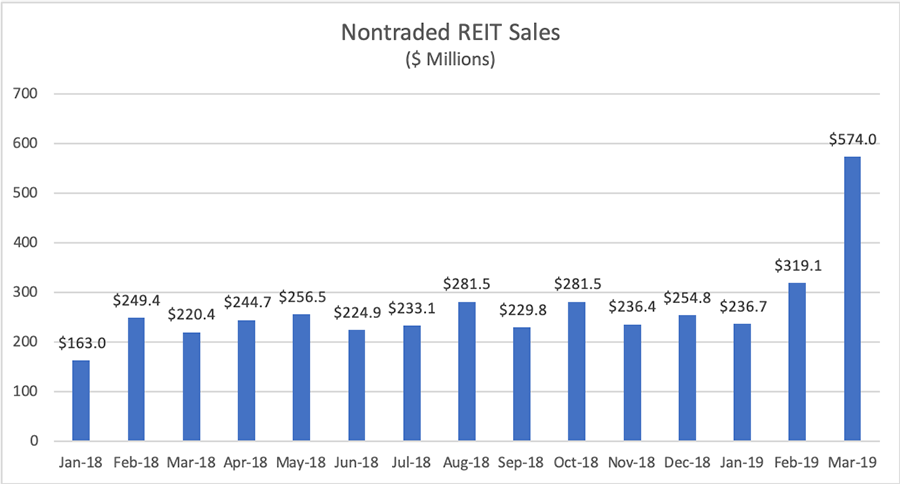
Once again Blackstone REIT led the sector with $1.129 billion in capital raise in Q1 2019 with a 66% market share after raising a total of $2.88 billion for the year 2018. Griffin-American Healthcare REIT IV was next with $94.6 million for a 5.5% share. Black Creek Industrial REIT IV was third with $88.9 million, followed by Hines Global Income Trust at $83.5 million. Starwood REIT’s $253.5 million in total NAV as of March 31, 2019, with 12.46 million shares outstanding, implies an estimated $86 million in capital raise in Q1 2019, which would place it just ahead of Hines Global Income Trust, had Starwood REIT reported its sales to Blue Vault.
Nontraded REITs with Limited Operations in Q1 2019
The nontraded REITs in the table below are beginning to raise capital and build real estate asset portfolios. Equity capital raised in their public offerings, excluding private placement capital, are estimated from SEC filings, prior to the filings of Q1 2019 quarterly reports.
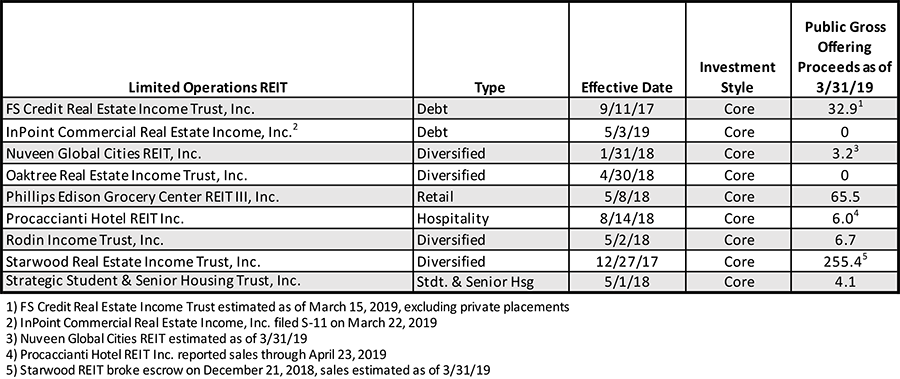
With similar plans to raise capital for their programs through wire house channels, the offerings from Nuveen, Starwood, Oaktree and Cantor Fitzgerald (Rodin) have the potential to increase the total capital raise for the NTR sector significantly, as they gain traction in the space.
Nontraded REIT Capital Raise by Share Class
Sales by open nontraded REIT programs in the first quarter of 2019 are dominated by the sales of Class S, Class I and Class T shares.
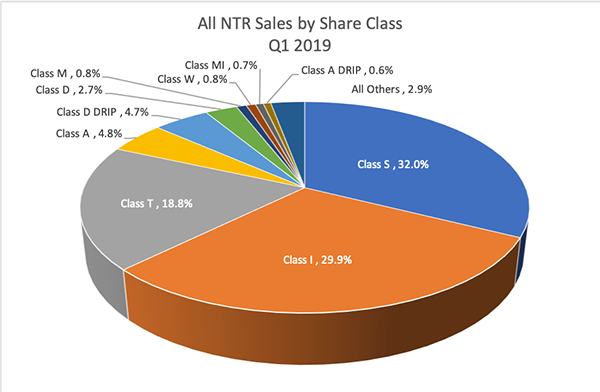
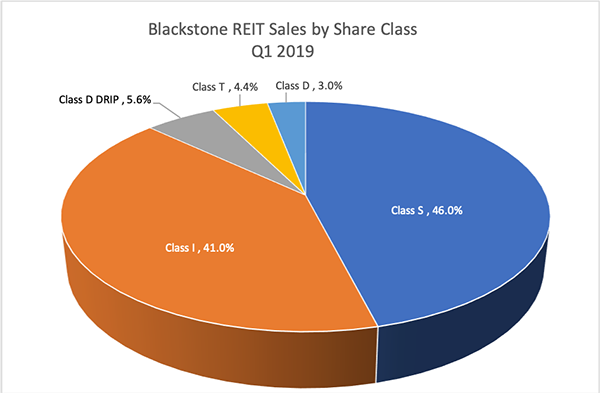
Because Blackstone REIT had 66.0% of the capital raise in Q1 2019, the share class mix of Blackstone REIT sales1 had an important impact on the NTR capital raise share class mix:
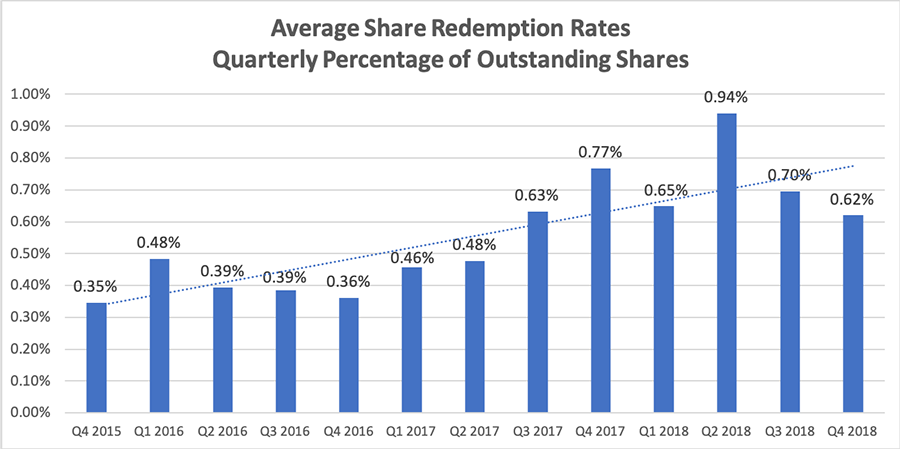
NTR Share Redemption Rates
Blue Vault tracks shares redeemed by NTRs with share redemption programs and the percentage of weighted average shares outstanding that are redeemed by each program. The average percentage of shares redeemed has been trending downward since reaching a peak in Q2 2018. Redemption rates would generally be increasing with the trend toward perpetual offerings with increased liquidity features, but the suspension of redemption programs by large REITs such as Benefit Partners and Healthcare Trust can reduce the averages. There were 6.173 billion common shares outstanding for all nontraded REITs calculated on a weighted average basis in Q4 2018. Total shares redeemed for the quarter were 30,275,188, resulting in an average for the industry collectively of just 0.49%, even though the average for all REITs individually was 0.62%.
Among the perpetual nontraded REIT offerings, Black Creek Diversified Property Trust, Inc. (3.44%), CIM Income NAV, Inc. (2.63%), Jones Lang LaSalle Income Property Trust, Inc. (1.58%), and RREEF Property Trust, Inc. (3.97%) have higher than average redemption rates each quarter as a liquidity feature in their programs. Blackstone REIT, the largest offering in terms of 2018 sales, had just a 0.57% redemption rate for Q4 2018, based upon weighted average shares outstanding of 416,065,014 and redemptions of 2,392,116 shares.
Nontraded BDC Industry Trends and Facts
Key Facts:
•$20.9 billion in assets under management compared to $21.5 at December 31, 2017
•Average distribution yield of 6.79% for 2018 compared to 6.98% for 2017
•Industry capital raise of approximately $140 million in the first quarter of 2019 compared to $157 million in Q4 2018
•Owl Rock Capital Corporation raised 91% of total industry raise in the first quarter of 2019 with $127.4 million
•Five open funds raised capital in Q1 2019, and 12 funds had closed offerings
•Two BDCs are now listed: FS Investment Corporation (NYSE: FSIC) and Corporate Capital Trust (NYSE: CCT)

Year-Over-Year Total Returns for Nontraded BDC Shares
Nontraded BDCs posted a median return of 1.96% in 2018, down significantly from the median return of 6.52% in 2017 and the median return of 12.97% for 2016. Despite the poor returns, the industry outperformed both the S&P/LSTA Leveraged Loan Index, which posted a return of -0.62%, and the BofA Merrill Lynch High Yield Index, which posted a -2.27% return.
Three BDCs had better returns in 2018 than 2017: MacKenzie Realty Capital’s 11.73% return led all nontraded BDCs for 2018. Owl Rock Capital Corporation II increased its total return in 2018 to 6.70% from 5.90% in 2017. FS Energy & Power Fund improved from its 2017 negative return of -3.29% to negative -2.11%.

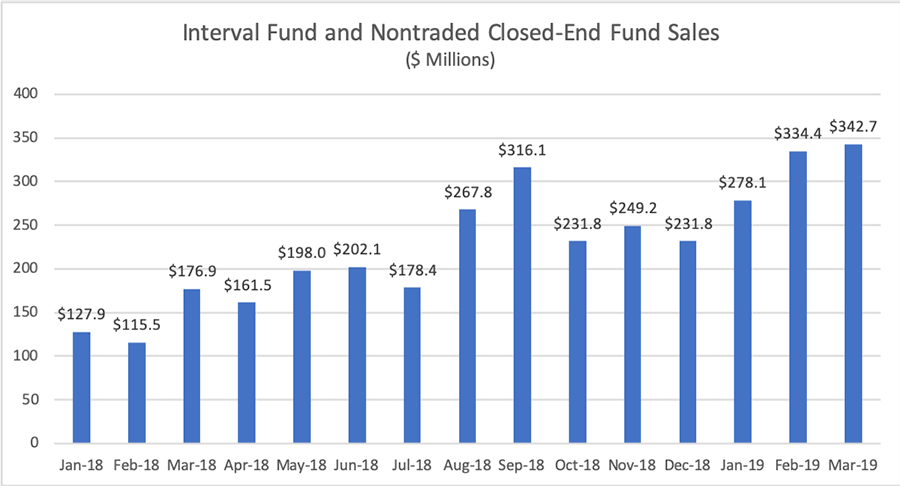
Interval Funds and Nontraded Closed-End Funds
Interval funds and nontraded closed-end funds reporting to Blue Vault increased their month-to-month capital raise during Q1 2019, as the total for the quarter was 34% above the total for Q4 2018. The Q1 2019 total for those funds reporting sales was $955.2 million compared to sales in Q4 2018 reported to Blue Vault by the same programs of $712.8 million.
The Interval Funds and Nontraded Closed-End Funds that reported sales to Blue Vault for the first quarter of 2019 were:
•Blackstone/GSO Floating Rate Enhanced Income Fund
•Bluerock Total Income+ Real Estate Fund
•CION Ares Diversified Credit Fund
•Griffin Institutional Access Real Estate Fund
•Griffin Institutional Access Credit Fund
•NexPoint Real Estate Strategies Fund
•Resource Credit Income Fund
•Resource Diversified Income Fund
•SharesPost 100 Fund
Blue Vault produced individual Interval Fund reports for the following funds for the period ending December 31, 2018 (interval funds file financial reports semi-annually):
•Alternative Strategies Fund
•Griffin Institutional Access Credit Fund
•NexPoint Real Estate Strategies Fund
•OFI Carlyle Private Credit Fund
•PIMCO Flexible Credit Income Fund
•RiverNorth Marketplace Lending Corporation
•SharesPost 100 Fund
•Sierra Total Return Fund
•Wildermuth Endowment Fund
Blue Vault produced individual Nontraded Closed-End Fund reports for the following funds for the period ending December 31, 2018 (nontraded closed-end funds file financial reports semi-annually):
•Blackstone Real Estate Income Fund
•FS Global Credit Opportunities Fund
•CC Real Estate Income Master Fund
•Priority Income Fund
•Stira Alcentra Global Credit Fund
1Blackstone REIT’s Class S shares are sold with a 3.5% upfront selling commission and have a 0.85% annual stockholder servicing fee. Class I shares are available through fee-based programs (wrap accounts) and institutional investors. Class T shares have upfront selling commissions of 3.0% and dealer manager fee of 0.5% and have an 0.85% stockholder servicing fee. Class D shares have an upfront selling commission of 1.5% and a stockholder servicing fee of 0.25% per annum. They are available for purchase through fee-based programs (wrap accounts) and broker-dealers that have alternative fee arrangements.