Capitalization Rates Recapped in Today’s Market Environment
In an Insights article on the Blue Vault website in September, 2015, we defined capitalization rates and explained how they relate to values at the property level and the portfolio level.
Real estate investments produce income available to investors in the form of NOI, or Net Operating Income. This is the revenue generated by a property less all normal operating expenses, before depreciation, interest expense and capital expenditures. The value of a property at acquisition is sometimes described in terms of its “cap rate” to provide a reference or relative value to other similar transactions occurring in a similar timeframe. One method of estimating the market value of a REIT’s portfolio of properties is to “capitalize” the REIT’s NOI using a capitalization rate. The math is simple:
Just as in the case of stock or bond investments, this equation relates the value of the investment to the average return it is expected to produce. It is an inverse relationship. When commercial real estate investors evaluate how much they are willing to pay for a property or a portfolio, and when appraisers estimate the value of a REIT’s properties in determining a range of net asset values (NAVs), the capitalization rate is the discount rate used to reduce a stream of future NOI to a present value. Of course, the above equation is a gross simplification because it assumes that NOI is a constant. Using an NOI estimate for the next year may be relatively simple, and using capitalization rates observed in recent market transactions for similar assets can be a starting point. However, a formula that better represents the reality of market values would incorporate the expectations of future growth in NOI. If NOI is expected to grow, other things equal, the property is more valuable. A simple adjustment to the formula incorporates the future growth potential of NOI:
![]()
In this formula, “ĝ” is an estimated growth rate for NOI. If NOI is assumed to be constant in the future, ĝ = 0, then the formula reduces to the simpler form. If ĝ is expected to be greater than zero, the value of the property or portfolio will be greater. Simply put, a property that produces a growing stream of earnings is more valuable, other things equal, than a property that doesn’t grow its earnings.
Within cap rates, as with any required rate of return, is a “risk premium” or some portion of the expected rate of return that compensates investors for the risk they perceive with the particular investment. Other things equal, the more risk that investors perceive with a given forecast of NOI, the higher the capitalization rates used to estimate the value of the property. For individual properties and for portfolios, as well as for property types or sectors, capitalization rates will differ due to different perceived risks. To the extent that capitalization rates incorporate expected growth in NOI, different properties, portfolios and sectors will report different cap rates in recent market transactions based upon investor expectations of those differing growth expectations. For example, in a market with high growth expectations and potential, the cap rates for recent transactions will be lower than those for transactions in markets with lower growth expectations. Likewise, for risk premiums. Other things equal, cap rates in markets perceived as having less risk for future NOI will be lower than those cap rates in markets with higher perceived risks.
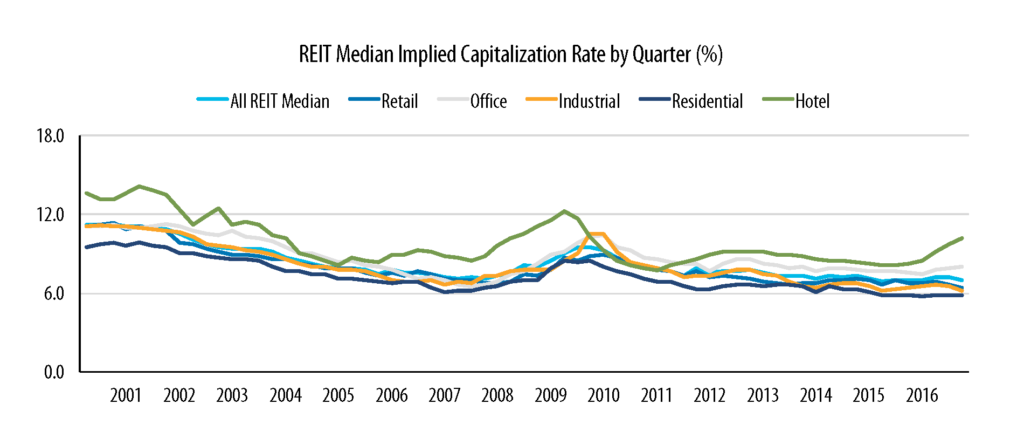
SNL Financial publishes “implied capitalization rates” for different property types each quarter based upon market transactions. These rates will rise and fall with investor expectations for both risk and growth in NOI. When a particular sector is expected to grow NOI faster than other sectors, implied cap rates for transactions in the sector will be lower than in other sectors. When risks are perceived to be higher, cap rates will be higher. For example, if one sector appears to be over-built, investors will take into account the impact such excess supply will have on future NOI (pressure on occupancies and rents that will reduce income) and cap rates will be higher, other things equal.
The variation in cap rates for different sectors of the commercial real estate market will reflect both macro economic conditions (e.g. the financial crisis and recession in 2007-2009) and the unique factors in each sector.
The variation in cap rates for different sectors of the commercial real estate market will reflect both macro economic conditions (e.g. the financial crisis and recession in 2007-2009) and the unique factors in each sector.
When we evaluate the potential for REIT programs to generate returns for investors, we also must consider the REIT’s use of leverage and the cost of that leverage in the interest rates that REITs pay to utilize debt in financing their portfolios. When a REIT borrows at a rate of interest that is significantly below the cap rates related to their property investments, they are using leverage to boost returns to shareholders. The cap rate represents the rate of return on a property investment, before depreciation, interest expense and capital expenditures. To the extent that the cap rate exceeds the cost of the REIT’s debt, its returns as measured by NOI are going to be sufficient to fund distributions and capital improvements after meeting its borrowing obligations. One way to evaluate the potential for the industry to do this is to look at the spread between current cap rates and interest rates. The greater the spread, the more margin that commercial real estate investments have to provide distributions and fund further investments, either in existing properties or acquisitions.
To analyze the spreads between cap rates and the cost of debt for any particular property or REIT would require specific data at the property or REIT level. However, we can look at average industry cap rates and market interest rates to get an idea about the spreads in the macro environment:

This chart illustrates that the historically low interest rates in 2016 were not necessarily followed downward by market REIT cap rates. The spread between cap rates and 10-Year Treasury Bond Yields actually rose during 2016, indicating a margin of safety exists between the cap rates determining market values of properties and the cost of debt used to finance them. Another way of expressing the same concept is to suggest that the rise in interest rates we observed in Q4 2016 would not necessarily translate into lower property values or more risk in commercial real estate, especially if it is accompanied by renewed or accelerated economic growth which can translate into higher growth rates for NOI, occupancies and lease rates.
The spread between cap rates and market interest rate reached a low in 2007, just before the crash in real estate values. The same conditions do not appear to be present in late 2016, as underwriters appear to be valuing real estate properties conservatively and not allowing spreads to fall.
Sources: SNL, St. Louis Federal Reserve Bank