Zach Mersmann | Blue Vault
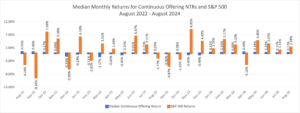
Ten of the sixteen continuously offered nontraded REIT programs reported declines in their Class I NAVs per share in August 2024. The six remaining REITs reported increases in their Class I NAVs per share. RREEF Property Trust (“RREEF”) posted the highest positive adjustment at 0.52%. The median monthly change in NAV per share was negative 0.11%. This drop in NAVs per share resulted in a median total return to shareholders of 0.17% for the 14 REITs with available return data (Ares does not make either of their REITs’ return data publicly available). It should also be noted that Blackstone Real Estate Income Trust and Starwood Real Estate Income Trust, which make up approximately 77% (as of Q2 2024) of the total assets for the 16 REITs, experienced a decrease in their NAV per share at negative 0.31% and negative 0.98%, respectively.
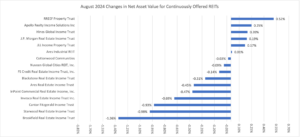
Brookfield Real Estate Income Trust (“Brookfield”) suffered the greatest decline in its NAV per share at negative 1.36%. Over the trailing 12-month period, BV estimated the total return to Brookfield Class I shareholders at negative 1.31%, which is a slight decrease from the previous month of negative 1.20%. A contributing factor to this decrease is Brookfield’s monthly return for August of negative 0.80%.
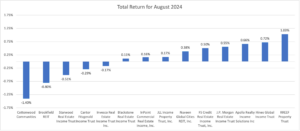
With a monthly pro-rated distribution rate, nine of the 14 NAV REITs had positive Class I shareholder returns in August 2024. The median total return for August for the group was 0.17%, which is a slight decrease from the prior month’s median total return of 0.19%. This is the fourth consecutive decrease in the median monthly returns for the 14 NAV REITs after hitting a 19-month high of 0.40% in April. As seen in Chart I, RREEF has the largest increases in Class I NAVs per share. Chart III shows the positive total returns for nine of 14 NAV REITs, with RREEF leading the group.
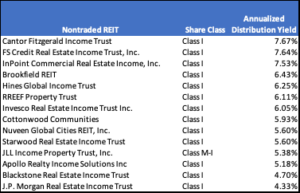
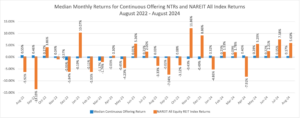
All the NAV REITs were distributing cash to their Class I shareholders at rates above the average dividend yield on the S&P 500 (1.32% as of June 2024) and the NAREIT All Equity REIT Index for listed REITs (3.67% as of August 2024). All NAV REITs had a distribution yield for Class I shares that exceeded the average distribution yield for listed REITs. The median distribution yield for the 14 NTRs was 5.99% as of August 31, 2024.
“These strong distribution rates compared to the indices are one of the reasons investors continue to be drawn to this market,” said Luke Schmidt, Vice President of Research at Blue Vault. “Consistent distributions from nontraded REITs continue to provide a dependable source of recurring income for shareholders, something that isn’t always seen in the public markets.”
Table I Distribution Yields for NAV REITs as of August 31, 2024
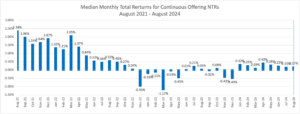
Since January 2022, the median total returns for the nontraded REITs were negative nine out of 32 months with eight of those months coming in 2023. The S&P 500 Index had negative total returns for twelve of the 32 months. The listed REIT index had negative total returns in 16 of the 32 months. The median monthly total return for the continuous offering NTRs has been positive in each of the first eight months of 2024 ranging from 0.09% to 0.40%.
Blackstone REIT posted impressive increases in the net asset values per share from December 2020 until peaking in September 2022. From a high of $15.11 per share for its Class I shares, the REIT suffered decreases in its NAV through 2023, reaching a low for the year of $14.10 in December 2023. From the end of 2023, the NAV peaked at $14.19 in March and April 2024 before dipping below its year end price to $13.98 in August.
While the NAV increased slightly in each of the first three months in 2024, (representing the first increases since August 2023), the NAV decreased by 1.51% from April to August in 2024. As the largest nontraded REIT by far, with over $55.5 billion in cumulative net asset value as of August 31, 2024, Blackstone REIT’s valuations may be indicative of the trend across the sixteen continuously offered REITs.
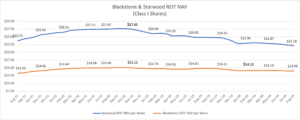
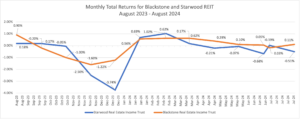
Starwood REIT, with over $9.4 billion in cumulative net asset value as of August 31, 2024, has followed a similar path to Blackstone REIT since 2022. Like Blackstone, Starwood also hit a high in September 2022 at $27.63 followed by a decrease in NAV in 2023. The REIT’s NAV per share has declined by 3.40% since the beginning of 2024 and 10.56% since August 2023. Comparatively, Blackstone REIT’s NAV has dropped 6.14% since August 2023. The resulting total returns for Starwood REIT and Blackstone REIT, offset by their distributions during the quarter, are shown below.
Blue Vault members may sign in to view full reports or individual pages in the Research Portal. If you are not a member, click here to see our Membership options.
Links to Blue Vault’s Classic PDFs are located in the Review and analyze fund performance section.