James Sprow | Blue Vault
Every continuously offered nontraded REIT program calculates and reports net asset values per share (NAVs) on a monthly basis. These REITs engage third-party valuation firms to estimate the values of their portfolios, including real properties and CRE-related securities. A standard method for estimating values is to use discount rates to find the present value of the cash flows being generated by a REIT’s real estate investments. Two types of discount rates are typically estimated: a “discount rate” and an “exit capitalization rate.” Both rates are applied to expected cash flows, and the sum of those discounted cash flows is defined as the aggregate net asset value of the REIT’s property investments. For many REITs, the net asset value of properties makes up a significant portion of its aggregate net asset value and changes in the net asset value of properties can explain changes in its net asset value per share. Dividing the REIT’s aggregate net asset value by the number of common shares outstanding gives an estimated net asset value per share.
The third-party valuation firm presents the quarterly estimates of the REIT’s values per share to the Board of Directors, usually as a range of values from low to high due to the inherent uncertainty in the process. The Board of Directors will then select a value to report as the estimated net asset value for a given month, usually a mid-point between the low and high values estimated by the valuation firm.
The estimated net asset values per share are important in several ways. NAV REITs (the continuously offered nontraded REITs) use the NAVs announced each month to price the issuance of new common shares for the following month, and also as the stated redemption price for share repurchases. Investors can also use the changes in monthly NAVs plus the calculated monthly rate of the REIT’s cash distributions as an estimate of the “total return” on their REIT share investments. Blue Vault reports these total returns as well as the percentage changes in each REIT’s NAV per share each month. Most REITs report their monthly NAVs by the third week of the following month.
Parameters Used in Calculating NAVs
In this article, we examine the parameters used by Blackstone Real Estate Income Trust (“BREIT”) in estimating their NAV’s per share in November 2023 and the changes in those parameters from the previous year’s parameters to determine how changes in those parameters impacted the REIT’s NAVs. In every 424b3 filing a REIT files monthly with the SEC, it reports the discount rates, exit capitalization rates and the estimated sensitivities the REIT’s asset values will have per every 25 basis point changes in those rates. With these disclosures, we can calculate an estimate of the overall changes in the REIT’s portfolio valuation over time, and which changes in discount rates and exit cap rates had impacts. (Note that we are not including changes in the REIT’s unconsolidated entities, real estate debt and real estate loans held by consolidated securitization vehicles portfolio which together made up approximately 24% of its total assets as of December 31, 2022.)
In the table below, we look at the discount rates and exit capitalization rates used by Blackstone REIT for the November 2023 valuation compared to the November 2022 valuation. When applied to the two valuations using the given sensitivities for each asset category, we can estimate the impact on the REIT’s property portfolio values over the 12-month period.
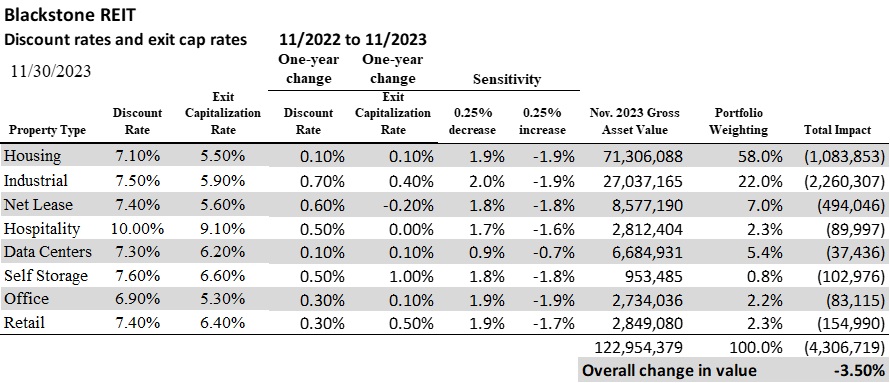
Interestingly, the hypothetical change in the REIT’s portfolio value (assuming the portfolio did not change significantly in composition) corresponded closely to the actual change in the REIT’s NAV per share. From November 2022 to November 2023, Blackstone REIT’s NAV per share for its Class I shares decreased from $14.88 to $14.33, a percentage change of 3.70%. Of course, the REIT’s real estate portfolio did not remain constant over that 12-month period, but the change in valuation explained by the change in the valuation parameters used in calculating the NAV was certainly significant.
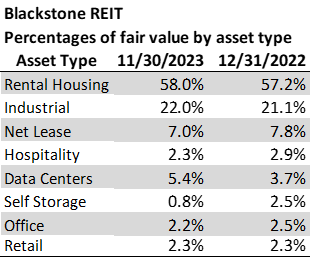
To check to see whether significant portfolio changes by asset types could be partially responsible for the changes in NAVs over the period, we look at the portfolios and compare the portion of each using percentage of fair value by asset type. The table below reveals that changes in the allocation of portfolio fair values are not, in themselves, responsible for the decrease in NAVs per share.
Conclusion
The changes in discount rates and exit capitalization rates used in calculating the estimated net asset values of a REIT’s real estate investments can have a significant impact on those values over time. We believe that the changes in valuation parameters used by third-party valuation firms in estimating the aggregate net asset values of portfolios such as those seen in the example of Blackstone Real Estate Income Trust over the period between November 2022 and November 2023 could explain a large portion of the drop in the REIT’s NAV per share.
Our opinion is that the changes in discount rates and exit capitalization rates used by valuation firms are highly correlated with changes in market interest rates. Discount rates and exit capitalization rates are in turn correlated with the required rates of return of investors. When interest rates are higher, investors require higher expected rates of return to hold investments such as shares of nontraded REITs.
Sources: Blue Vault, SEC