August 31, 2023 | James Sprow | Blue Vault
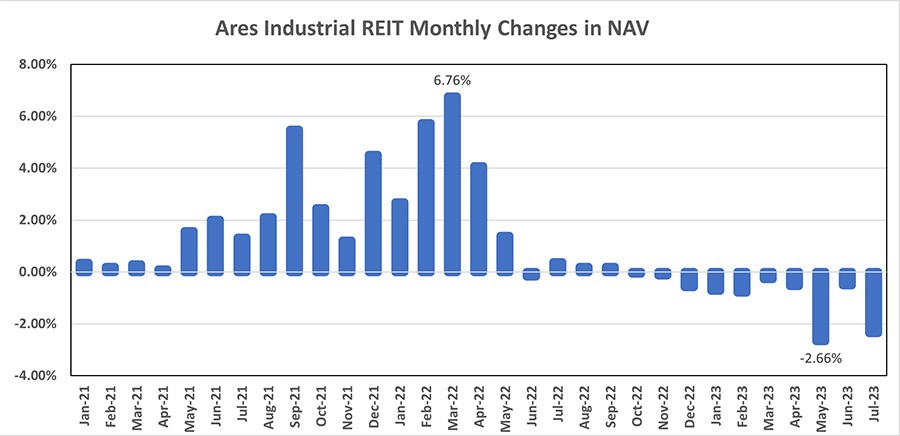
Ares Industrial REIT was a leader among the continuously offered nontraded REITs in 2021 when measured by the change in its net asset per share (NAV). For that entire year, only Blackstone REIT’s increase in NAV per share (+23.76%) out-shone Ares Industrial REIT (+23.70%) among its peers. In Q1 2022, Ares Industrial REIT’s NAV increased a whopping 15.92% while the median increase for the 13 other continuously offered NTRs was 3.50% for the quarter. But something has happened to the REIT’s NAVs since March 2022. The significant monthly increases in NAVs from May 2021 through May 2022 suddenly disappeared and recent trends, beginning in November 2022, have been negative. In this article we search for reasons for this reversal.
Industry Trends for Industrial REITs
The first place to look for explanations would be the industrial REIT sector in general. How have the listed REITs that invest in industrial assets performed over the same time span? NAREIT reports monthly total returns for 12 to 14 Industrial REITs over the period from December 2020 through June 2023. A simple plot of these total returns for listed industrial REITs and the total returns reported for Ares Industrial REIT shows a much greater volatility for the listed REIT returns than for Ares Industrial REIT’s returns.
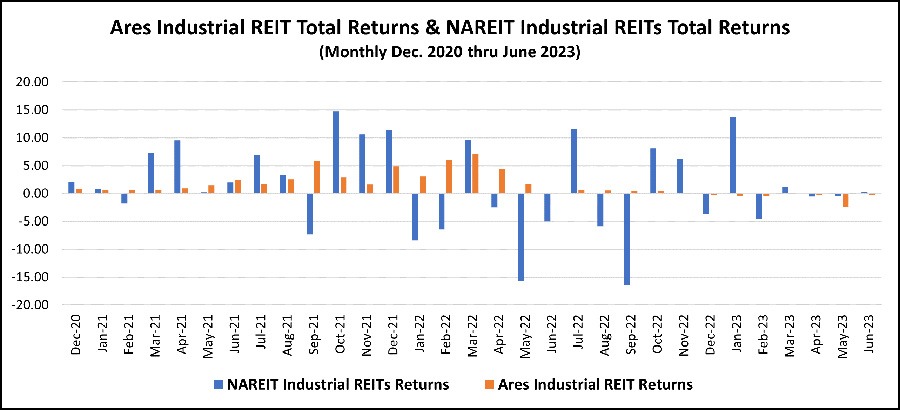
Clearly, there are many months when the returns to the two series diverged, particularly where the NAREIT Industrial REIT series was dramatically negative and the Ares Industrial REIT total return was positive for the same month. Interestingly, the NAREIT Industrial REITs index had positive monthly total returns for six of the 12 months from July 2022 through June 2023 and Ares Industrial REIT had positive total returns in six months also. But those positive monthly returns did not occur in the same months. In four months, the positive returns for one series were not matched with positive returns in the other series. Over the last seven months in the series, Ares Industrial REIT’s monthly total returns were consistently negative while the NAREIT Industrial REIT series had positive returns in three months.
A scatter plot of the two-return series shows the volatility of the listed industrial REITs returns series compared to the much less volatile Ares Industrial REIT returns.
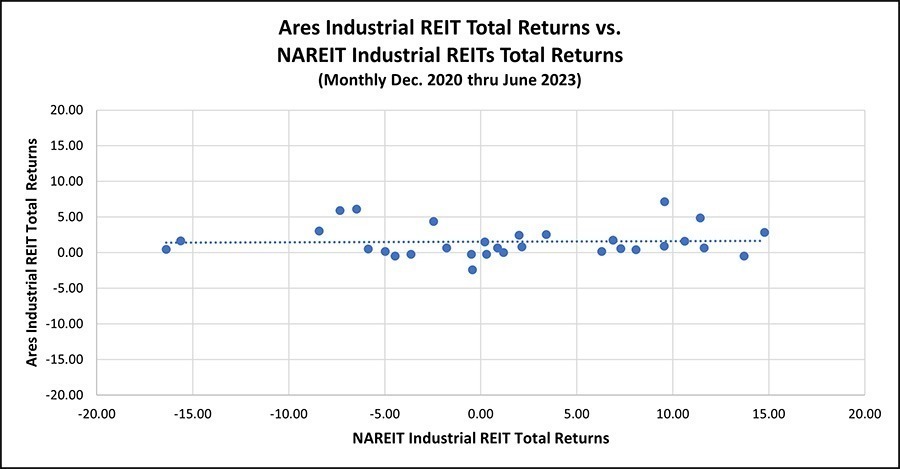
If the two series had any positive correlation, we would expect that correlation to show up as a 45-degree trend line. In fact, the correlation coefficient for the two series is just 0.024, virtually zero.
Evidence in the Discount Rates Used in Estimating NAVs
Continuously offered nontraded REITs report estimated net asset values every month. The changes in these net asset values each month, together with an accrual of the REIT’s distribution to represent the equivalent monthly distribution rate, add up to the monthly total returns reported by the REITs. Next, we look at the methodology used for estimating NAVs. Every month the REIT’s file with the SEC a form 424B3 that details the parameters used in estimating NAVs for common shares. Along with the discount rates used to estimate the present values of the REIT’s future cash flows, the REITs publish sensitivity percentages that estimate the effect on the NAV calculation if the discount rates vary up or down by 25 basis points.
In Ares Industrial REIT’s filing for July 2023, the NAV for Class I shares was stated at $14.1023. This was 7.94% less than the NAV as of July 2022 of $15.3182, which both explains and contributed to the negative trend among the REIT’s monthly total returns over that period. Next, we look at the discount rates used in the NAV calculations to see if the changes in those discount rates contributed to the negative trend in NAV.
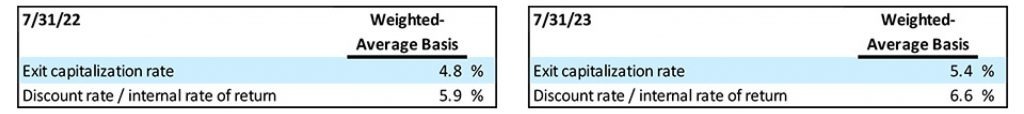
Here we see that the discount rates used in estimating the NAVs per share increased significantly over the past 12 months. Other things equal, higher discount rates used in evaluating a REIT’s forecasted cash flows result in lower valuations. For example, the REIT reported that a 25-basis point increase in the “Exit capitalization rate”, used to find the present value of real properties after their respective holding periods, would decrease those present values by approximately 3.50%. The REIT reported a 60-basis point increase in the “Exit capitalization rate”, indicating a reduction in the value of its real properties of 8.40%. The 70-basis point increase in the “Discount rate / internal rate of return” parameter used in its valuation estimate would reduce the present value of its real properties by 5.88%, according to the REIT’s estimated sensitivity of that rate in property values. Taken together, these changes in the discount rates used in estimating the NAV per share can explain a 14.28% reduction in that estimate over the 12-month period. This more than accounts for the drop in NAV reported above.
Discount rates are a function of the market’s required rate of return for similar investments (e.g., capitalization rates) which are also greatly impacted by market interest rates. Other things equal, investors in nontraded REITs and other assets require a rate of return that is influenced by market rates of interest that have gone up significantly in the 12-months covered by this analysis. For example, the Fed reports that 30-year mortgage rates reached 6.71% at the end of June 2023, up from 5.70% as of June 2022, a rise of over 100 basis points. If interest rate increases impacted the discount rates used in Ares Industrial REIT’s NAV calculations, that factor alone could explain much of the NAV’s decline.
Sources: SEC, FRED, Ares Industrial REIT’s website, Blue Vault Database