Median November Total Returns to Continuously Offered NTRs Are Negative
December 29, 2022 | James Sprow | Blue Vault
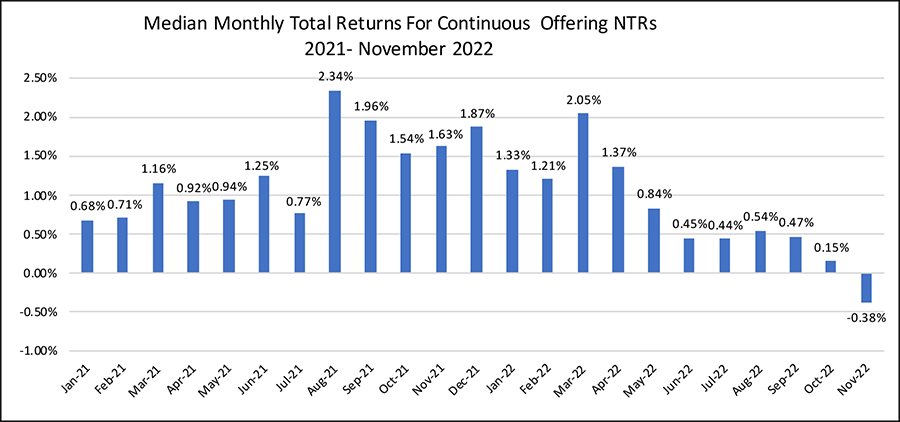
The 15 continuously offered nontraded REIT programs posted the first negative median returns for the group since March 2020, the beginning of the COVID-19 pandemic. The median total return, calculated as the sum of the percentage change in the NAVs per share and the monthly distribution yield, was at negative 0.38%, down from 0.15% in October. The total returns YTD thru November had a median of 9.75%, comparing very favorably to the YTD total returns to the NAREIT All REIT Index of -21.64% and the S&P 500 of -13.27%.
Chart I
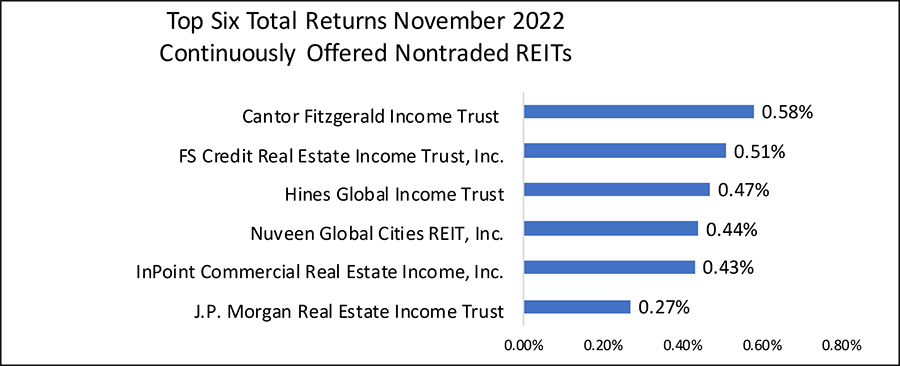
For the month of November 2022, the highest total return was Cantor Fitzgerald Income Trust with a return of 0.58%, followed by FS Credit Real Estate Income Trust at 0.51% and Hines Global Income Trust at 0.47%. November saw 8 of the 15 REITs with positive total returns ranging from the 0.58% for Cantor Fitzgerald Income Trust to -2.51% by Cottonwood Communities.
Chart II
The highest total return YTD thru November was recorded by Ares Industrial REIT at 27.05%, followed by Cottonwood Communities at 19.54% and Brookfield REIT at 14.47%. Only one continuously offered REIT had a negative total return thru November, InPoint Commercial Real Estate Income with a return of negative 1.16%.
Chart III
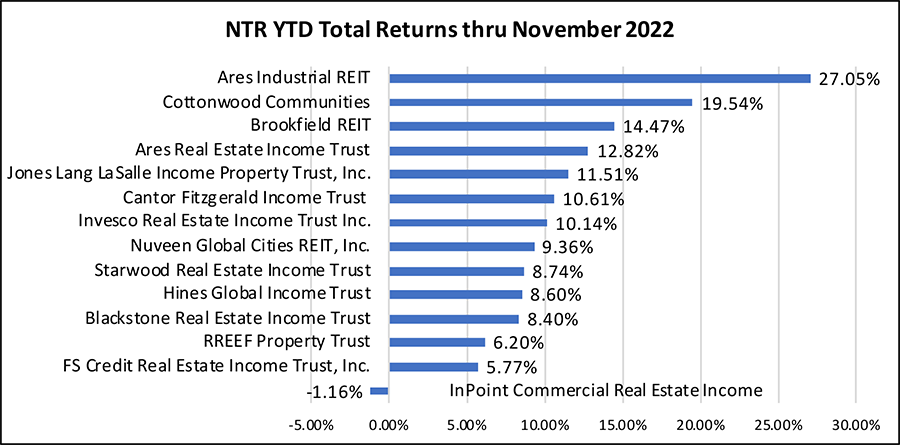
Chart IV
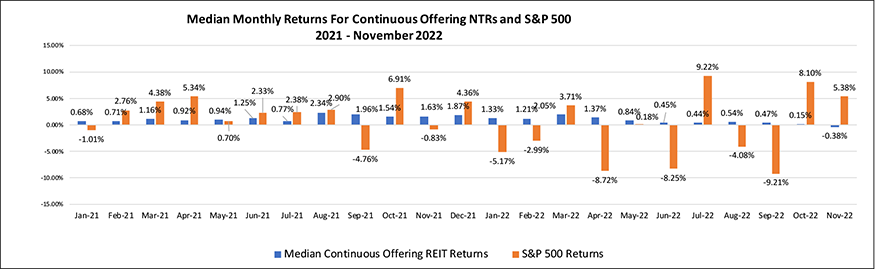
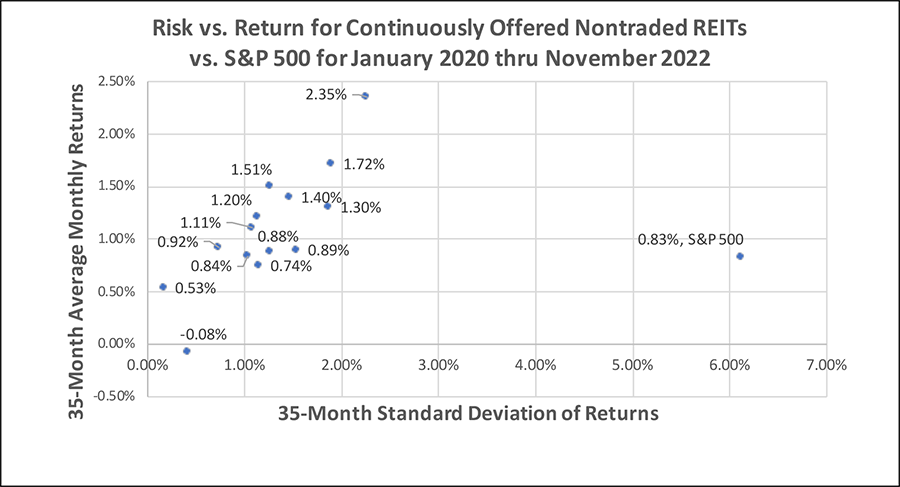
In terms of risk, the standard deviation of the monthly median returns for the NAV REITs over the last 35 months was 0.61%. The standard deviation of the S&P 500 monthly returns over the same period was 6.08%, or roughly 10 times the risk according to this commonly used metric. The correlation of the NTR monthly returns with the monthly returns of the S&P 500 Index over the last 35 months was a miniscule 0.020. This lack of correlation is another strong indicator of the value of using the continuously offered nontraded REITs in a diversified portfolio to reduce risk.
Chart V
Sources: Individual REIT websites; Blue Vault