NAV REITs Report Negative Median Total Returns for May
June 19, 2023 | James Sprow | Blue Vault
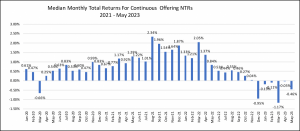
The median monthly total return for 16 continuously offered nontraded REIT programs (“NAV REITs”) was negative in May at -0.46% compared to negative 0.03% in April. Five of the 16 reported positive total returns. This is the sixth consecutive month that the NAV REITs have reported a median negative total return, comprised of the monthly changes in their net asset values (NAVs) and their pro rata distribution yields. Year-to-date in 2023, the median total return for the 16 REITs was negative 2.01%. The S&P 500 Index total return over the same five-month period was 9.64% and the NAREIT All Equity REIT Index total return was negative 2.27%.
Chart I
Just five nontraded REITs posted positive total returns in May, three less than did that in April. The highest monthly total return was posted by FS Credit Real Estate Income Trust at 0.68%. Blackstone Real Estate Income Trust was next with a positive return of 0.67%. InPoint Commercial Real Estate Income had the largest negative total return at -2.59%.
Chart II
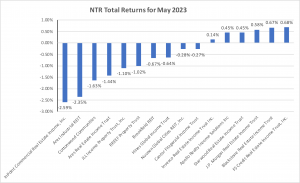
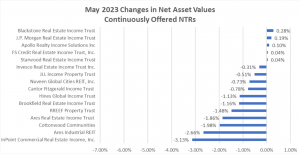
Chart III
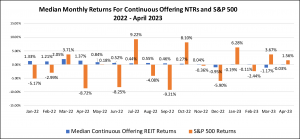
The favorable comparison in the relative volatility of the NAV REIT monthly returns is revealed when plotting the total returns of those REITs to the S&P 500 Index in Chart IV. The S&P 500 Index had a total of eight months in which returns were negative over the last 17 months while the nontraded REITs had only six.
Chart IV
Investors who consider the risk vs. return data will appreciate the favorable trade-off found in nontraded REITs with their average standard deviation of monthly total returns at 1.32% compared to the much higher standard deviation of the S&P 500 Index returns at 5.77% over the last 41 months. The average monthly return for the 11 REITs with monthly return data over 41 months was 0.76% compared to that of the S&P 500 Index at 0.77%. This comparison implies that nontraded REITs have much less risk but also have offered roughly average returns equal to those of listed common stocks.
Chart V
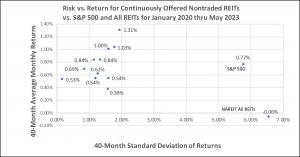
The monthly returns for NAV REITs compared very favorably to those of the listed REITs represented in the NAREIT All REITs Index. Chart V shows that the listed REITs had more volatility than the S&P 500 Index and a lower average rate of return over the last 41 months. Since January 2020, the listed REITs have had negative total returns in 18 of 41 months. Since January 2020, the standard deviation of monthly total returns for the listed REITs index was 6.56% while the average monthly return of negative 0.06% was negative 0.72% when annualized.
Chart VI
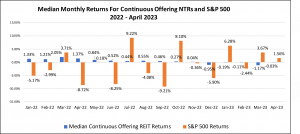
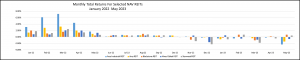
Chart VII vividly illustrates the decline in monthly total returns posted by the five largest NAV REITs. Beginning in June 2022, after a strong beginning to 2022, the REITs had modest monthly returns through October, but negative returns began to emerge in November and continued through January 2023. February began an upward trend in NAVs for these REITs that we thought might continue. Unfortunately, the results in March did not support that hope. May returns were encouraging for Blackstone REIT (+0.67%) and Starwood REIT (+0.45). Both REITs had positive total returns with small increases in their NAVs. A surprisingly negative total return for Ares Industrial REIT, one of the top total return performers in 2022, was due to a 2.66% drop in its Class I NAV per share, from $14.91 in April to $14.51 as of May 31, 2023.
Chart VII
Sources: Blue Vault, Individual REIT Websites, S&P 500, NAREIT, SEC