James Sprow | Blue Vault
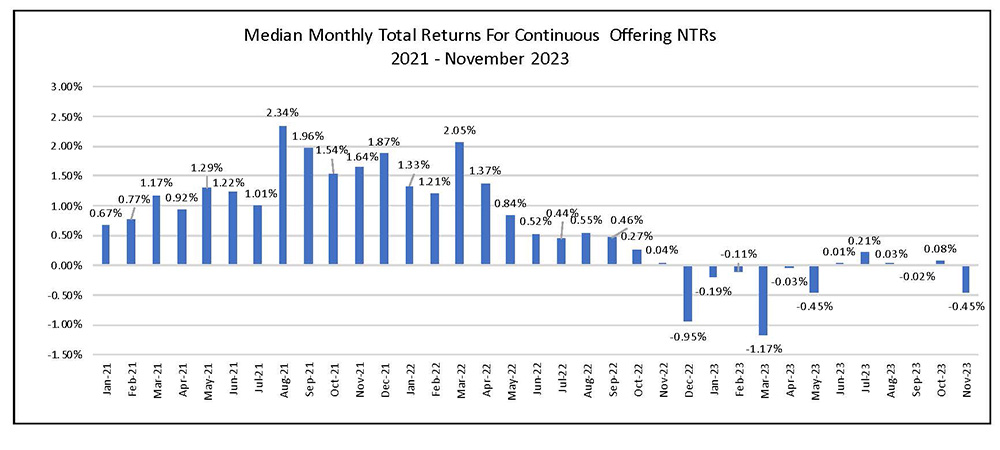
The median monthly total return for sixteen continuously offered nontraded REIT programs (“NAV REITs”) was -0.45% in November, compared to 0.08% in October. Ten of the sixteen reported negative total returns. Over the past 12 months, the median monthly return among the 16 REITs has been positive just four times. Year-to-date in 2023, the median total return for the 16 REITs was negative 4.33%. By contrast, the S&P 500 Index total return over the same eleven-month period was 20.56% and the NAREIT All Equity REIT Index total return was 2.28%.
Chart I
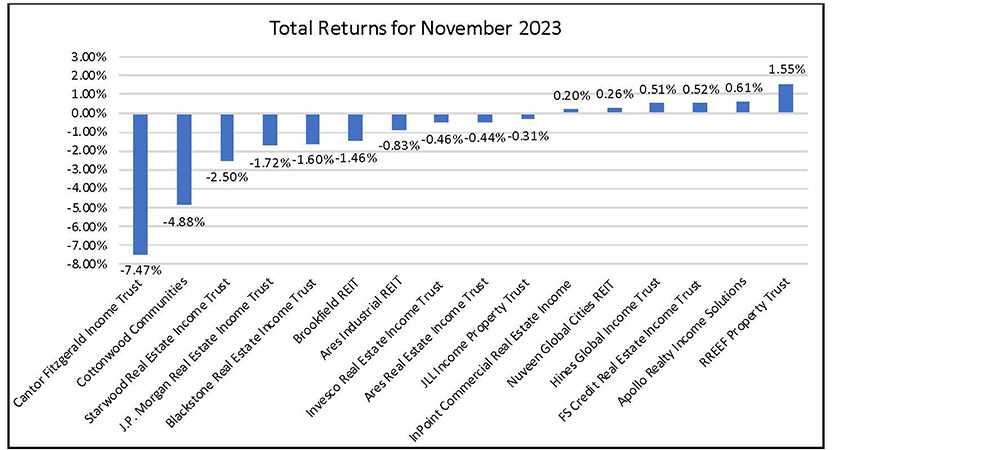
The six nontraded REITs that posted positive total returns in November were four less than did in October. The highest monthly total return in November was posted by RREEF Property Trust at 1.55%. Apollo Realty Income Solutions Inc. was next with a positive return of 0.61%. FS Credit Real Estate Income Trust ranked third with a total return of 0.52%. Hines Global Income Trust had the fourth largest total return at 0.51%, followed by Nuveen Global Cities REIT with a total return for November of 0.26%. Both FS Credit REIT and InPoint CRE Income invest in real estate debt rather than real properties.
Cantor Fitzgerald Income Trust had a negative total return in November of -7.47% due to an appraisal as of November 30 by Stanger of all but two properties in the REIT’s portfolio. The REIT expressed the desire to more accurately reflect the impact that high interest rates have had on CRE values. Blue Vault analysts believe the lags inherent in portfolio valuations at other nontraded REITs likely overstate monthly reported valuations. Cottonwood Communities reported a 4.88% month-to-month decrease in the Class I share NAV as of November 30.
The median distribution yield for the 16 REITs was 5.31% as of November 30, 2023.
Chart II
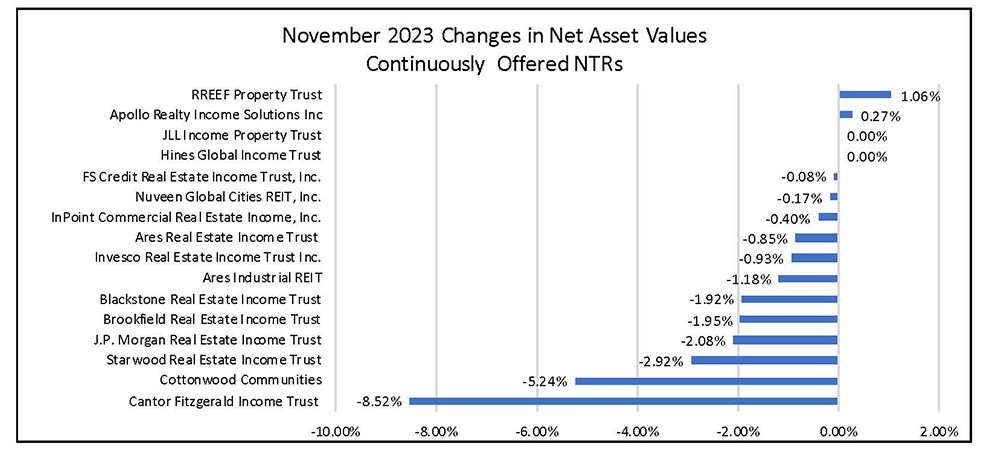
The following chart shows the contribution that monthly changes in per share net asset values (NAVs) make to the total returns. In calculating monthly total returns, the monthly distribution rate is added to the change in NAVs to arrive at an estimated total return.
Chart III
Lower Volatility for Nontraded REIT NAVs and Total Returns
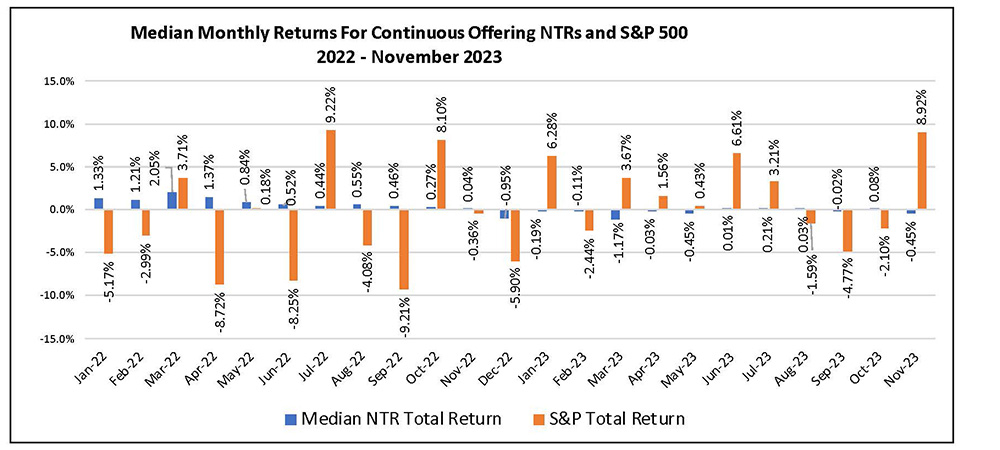
The favorable comparison in the relative volatility of the NAV REIT monthly returns is revealed when plotting the total returns of those REITs with the S&P 500 Index in Chart IV. The S&P 500 Index had a total of 12 months in which returns were negative over the last 23 months while the nontraded REITs had only eight.
Chart IV
Investors who consider the risk vs. return data will appreciate the favorable trade-off found in nontraded REITs with their average standard deviation of monthly total returns at 1.01% compared to the much higher standard deviation of the S&P 500 Index returns at 5.68% over the last 47 months. The average monthly return for the 11 REITs with monthly return data over 47 months was 0.62% compared to that of the S&P 500 Index at 0.89%. This comparison implies that nontraded REITs have much less risk but also have offered lower (0.27%) monthly average returns compared to those of listed common stocks.
The scatter plot in Chart V illustrates the much lower risk represented by the continuously offered nontraded REIT returns when compared to both the monthly returns of the S&P 500 Index and the NAREIT All Equity REIT Index. Both indices made up of listed common stocks have much higher standard deviations, roughly five times that of the nontraded REITs.
Chart V
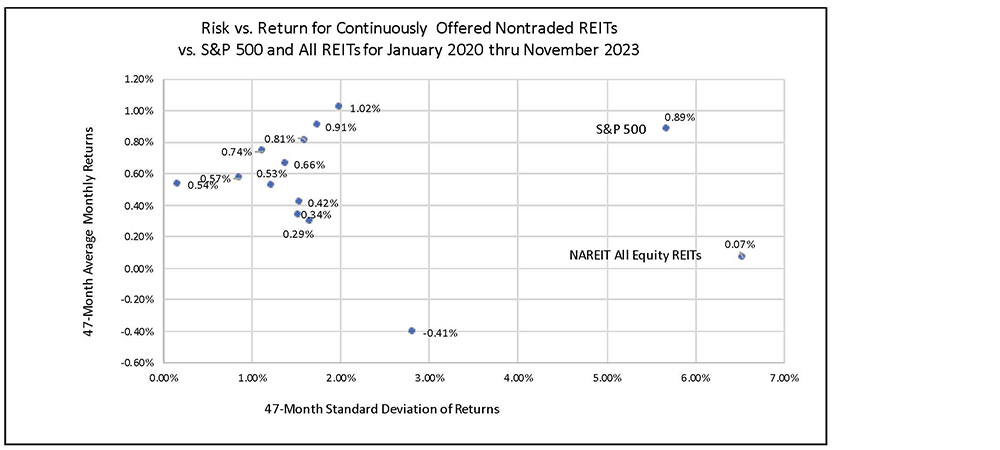
The monthly returns for NAV REITs compared very favorably to those of the listed REITs represented in the NAREIT All Equity REITs Index. Chart V shows that the listed REITs had more volatility than the S&P 500 Index and a lower average rate of return over the last 47 months. Since January 2020, the listed REITs have had negative total returns in 22 of 47 months. Since January 2020, the standard deviation of monthly total returns for the listed REITs index was 6.53% while the average monthly return of 0.0791% was just 0.79% when annualized.
The correlations over 47 months of total returns between the median returns for the nontraded REITs and the S&P 500 listed stocks index was just 0.075, which implies potential benefits for risk reduction in a portfolio combining the REITs with listed stocks. Surprisingly, the correlation between the nontraded REIT returns and returns on the NAREIT All Equity REITs Index of listed REITs was just 0.239, implying that the nontraded continuously offered REITs offer diversification benefits in a portfolio of listed REITs as well.
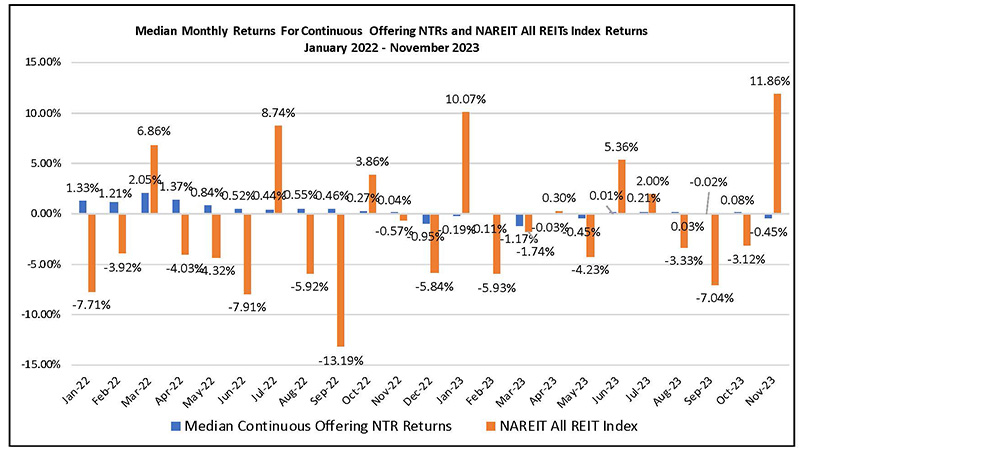
The next chart illustrates the difference in volatility between the median returns to the continuously offered nontraded REIT returns and the listed REIT returns. Listed REITs had the highest total return in November over the last 23 months at 11.86%, following the negative total returns experienced in the previous three months. In seven of the last 12 months, listed REITs suffered negative total returns.
Chart VI
Sources: Blue Vault, Individual REIT Websites, S&P 500, NAREIT, SEC