NAV REITs Report Positive Median Total Returns for July
August 22, 2023 | James Sprow | Blue Vault
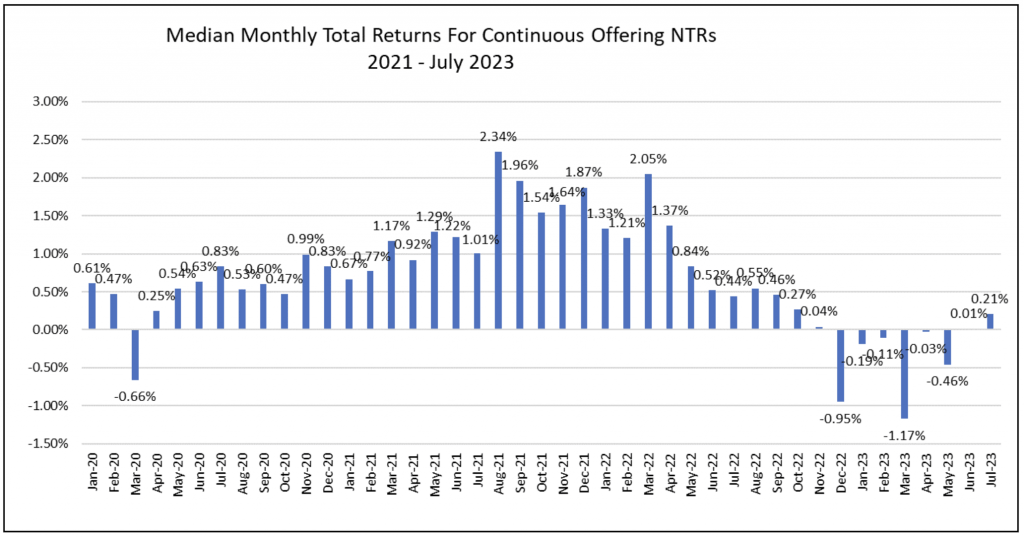
The median monthly total return for 16 continuously offered nontraded REIT programs (“NAV REITs”) was 0.21% in July, compared to just 0.01% in June. Ten of the 16 reported positive total returns. This is the second month since November 2022 that, as a group, the continuously offered nontraded REIT programs have reported a positive median return, albeit a very small one. Year-to-date in 2023, the median total return for the 16 REITs was negative 1.27%. By contrast, the S&P 500 Index total return over the same seven-month period was 20.64% and the NAREIT All Equity REIT Index total return was 5.03%.
Chart I
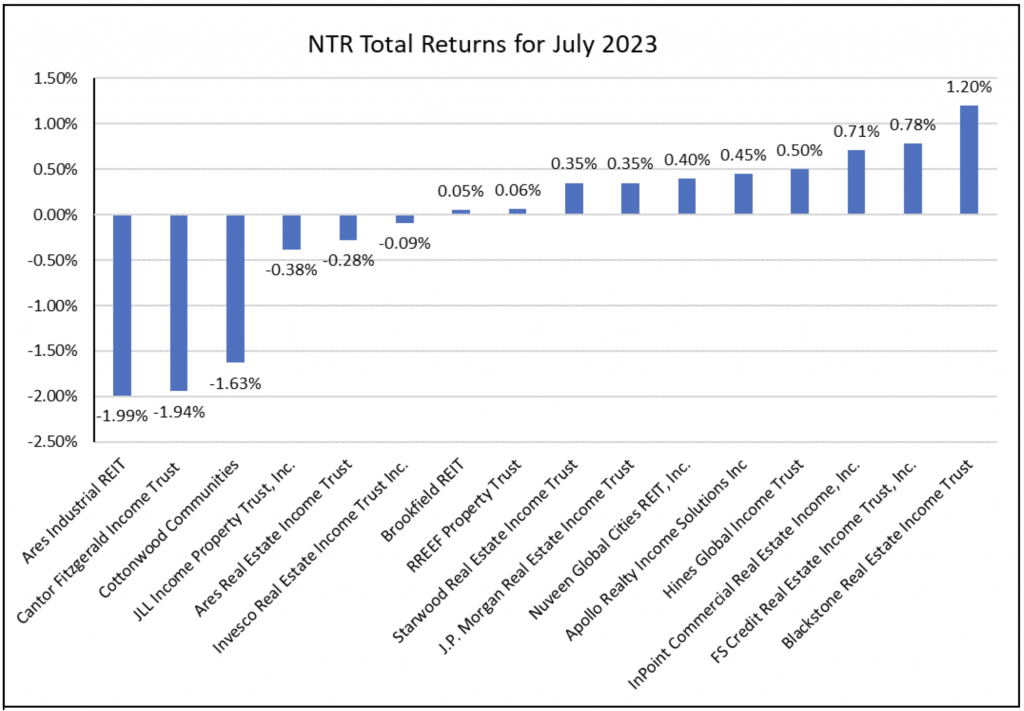
The ten nontraded REITs that posted positive total returns in July were two more than did in June. The highest monthly total return in July was posted by Blackstone Real Estate Income Trust at 1.20%. FS Credit Real Estate Income Trust was next with a positive return of 0.78%. InPoint Commercial Real Estate Income had the third largest total return at 0.71%, followed by Hines Global Income Trust at 0.50%. Both FS Credit REIT and InPoint CRE Income invest in real estate debt rather than real properties. Interestingly, InPoint CRE Income had the most negative total return in June at negative 5.58%.
Blackstone REIT’s total return led the 16 continuously offered or “NAV” REITs also in June at 1.00% and was second among the 16 REITs in May with a total return for that month of 0.67%. The REIT’s total return for July consisted of a 0.82% increase in the NAV of its Class I shares plus a distribution yield of 4.60% annualized, or approximately 0.38% monthly. The median distribution yield for the 16 REITs was 5.22% as of July 31, 2023.
Chart II
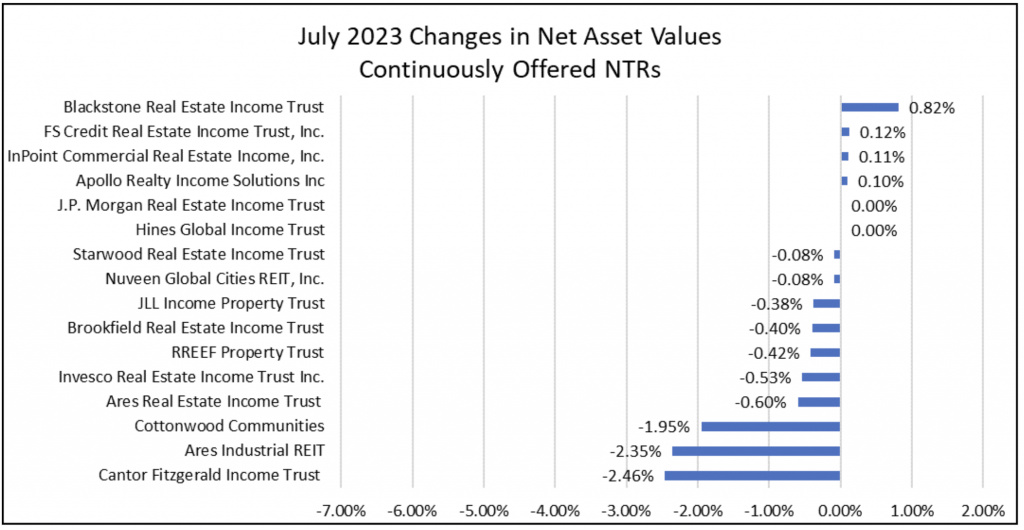
The following chart shows the contribution that monthly changes in per share net asset values (NAVs) make to the total returns. In calculating monthly total returns, the monthly distribution rate is added to the change in NAVs to arrive at an estimated total return.
Chart III
Lower Volatility for Nontraded REIT NAVs and Total Returns
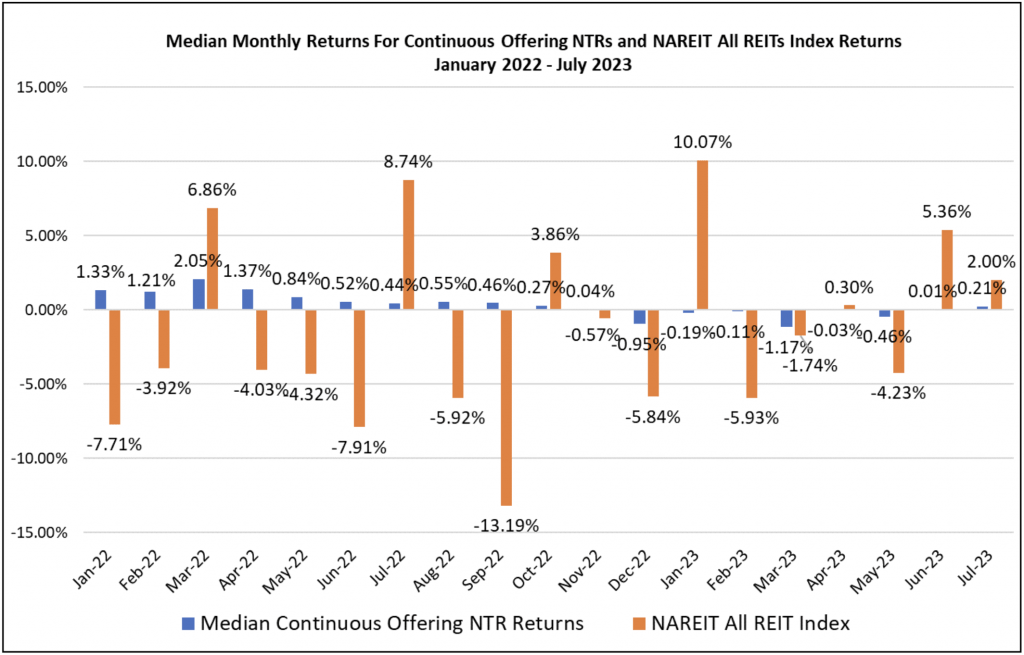
The favorable comparison in the relative volatility of the NAV REIT monthly returns is revealed when plotting the total returns of those REITs with the S&P 500 Index in Chart IV. The S&P 500 Index had a total of nine months in which returns were negative over the last 19 months while the nontraded REITs had only six.
Chart IV
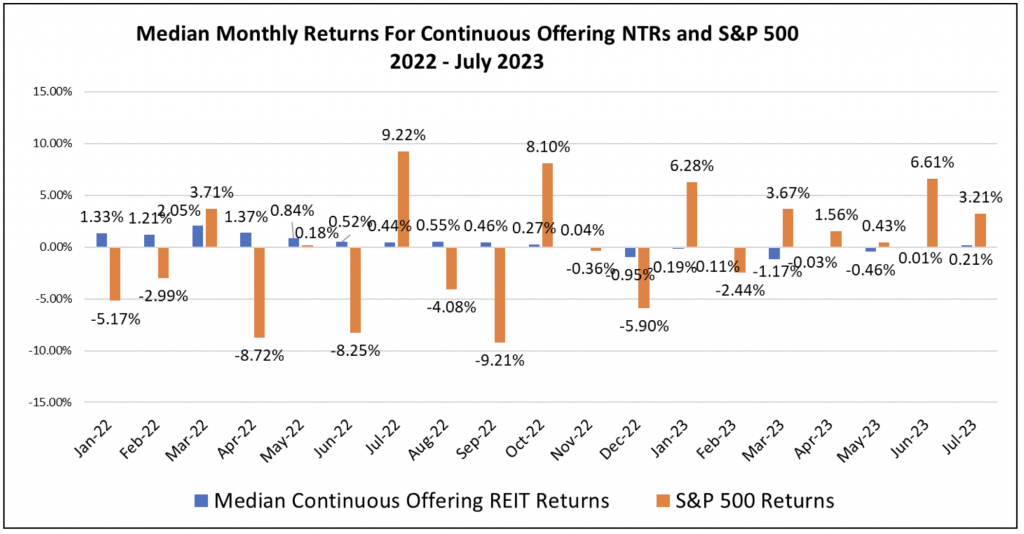
Investors who consider the risk vs. return data will appreciate the favorable trade-off found in nontraded REITs with their average standard deviation of monthly total returns at 1.32% compared to the much higher standard deviation of the S&P 500 Index returns at 5.72% over the last 43 months. The average monthly return for the 11 REITs with monthly return data over 43 months was 0.71% compared to that of the S&P 500 Index at 0.96%. This comparison implies that nontraded REITs have much less risk but also have offered just slightly lower (0.25%) monthly average returns compared to those of listed common stocks.
The scatter plot in Chart V illustrates the much lower risk represented by the continuously offered nontraded REIT returns when compared to both the monthly returns of the S&P 500 Index and the NAREIT All Equity REIT Index. Both indices made up of listed common stocks have much higher standard deviations, roughly four times that of the nontraded REITs.
Chart V
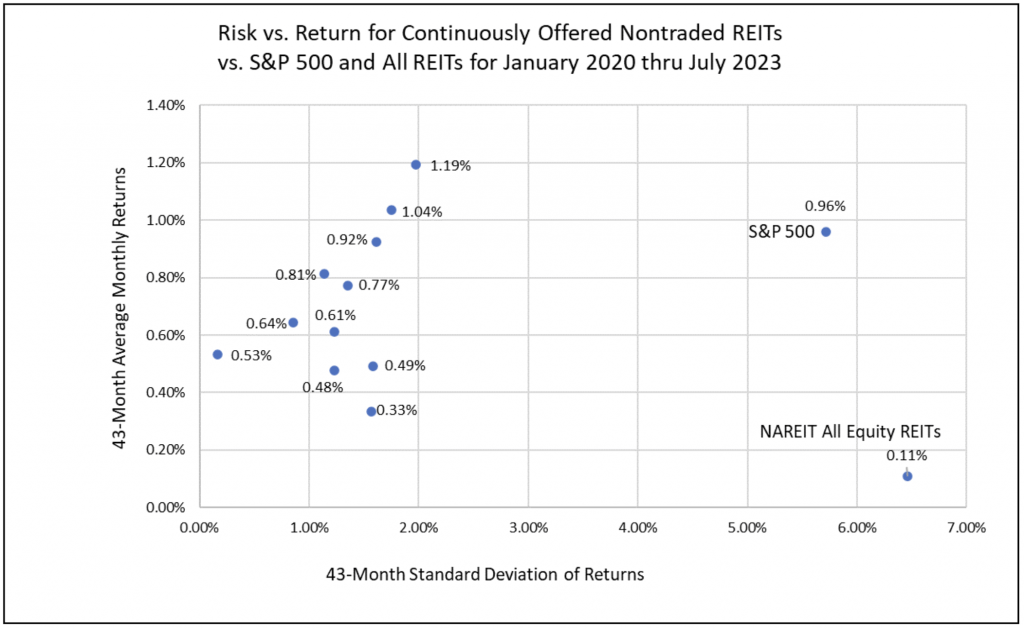
The monthly returns for NAV REITs compared very favorably to those of the listed REITs represented in the NAREIT All Equity REITs Index. Chart V shows that the listed REITs had more volatility than the S&P 500 Index and a lower average rate of return over the last 43 months. Since January 2020, the listed REITs have had negative total returns in 19 of 43 months. Since January 2020, the standard deviation of monthly total returns for the listed REITs index was 6.46% while the average monthly return of 0.11% was 1.33% when annualized.
The correlations over 43 months of total returns between the median returns for the nontraded REITs and the S&P 500 listed stocks index was just 0.091, which implies potential benefits for risk reduction in a portfolio combining the REITs with listed stocks. Surprisingly, the correlation between the nontraded REIT returns and returns on the NAREIT All Equity REITs Index of listed REITs was just 0.285, implying that the nontraded continuously offered REITs offer diversification benefits in a portfolio of listed REITs as well.
Chart VI
Trends in Total Returns to NAV REITs Since January 2022
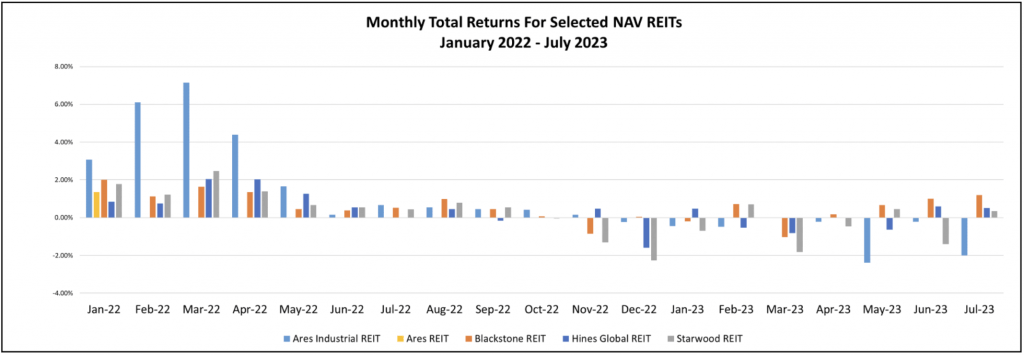
Chart VII vividly illustrates the decline in monthly total returns posted by the five largest NAV REITs. Beginning in June 2022, after a strong beginning to 2022, the REITs had modest monthly returns through October, but negative returns began to emerge in November and continued through January 2023. February began an upward trend in NAVs for these REITs that we thought might continue. Unfortunately, the results in March did not support that hope. May returns were encouraging for Blackstone REIT (+0.67%) and Starwood REIT (+0.45). Both REITs had positive total returns with small increases in their NAVs. A surprisingly negative total return for Ares Industrial REIT, one of the top total return performers in 2022, was due to a 3.3% drop in its Class I NAV per share, from $14.91 in April to $14.44 as of June 30, 2023. Blackstone REIT has been the star performer among the nontraded REITs since May.
Chart VII
Sources
Blue Vault, Individual REIT Websites, S&P 500, NAREIT, SEC