James Sprow | Blue Vault
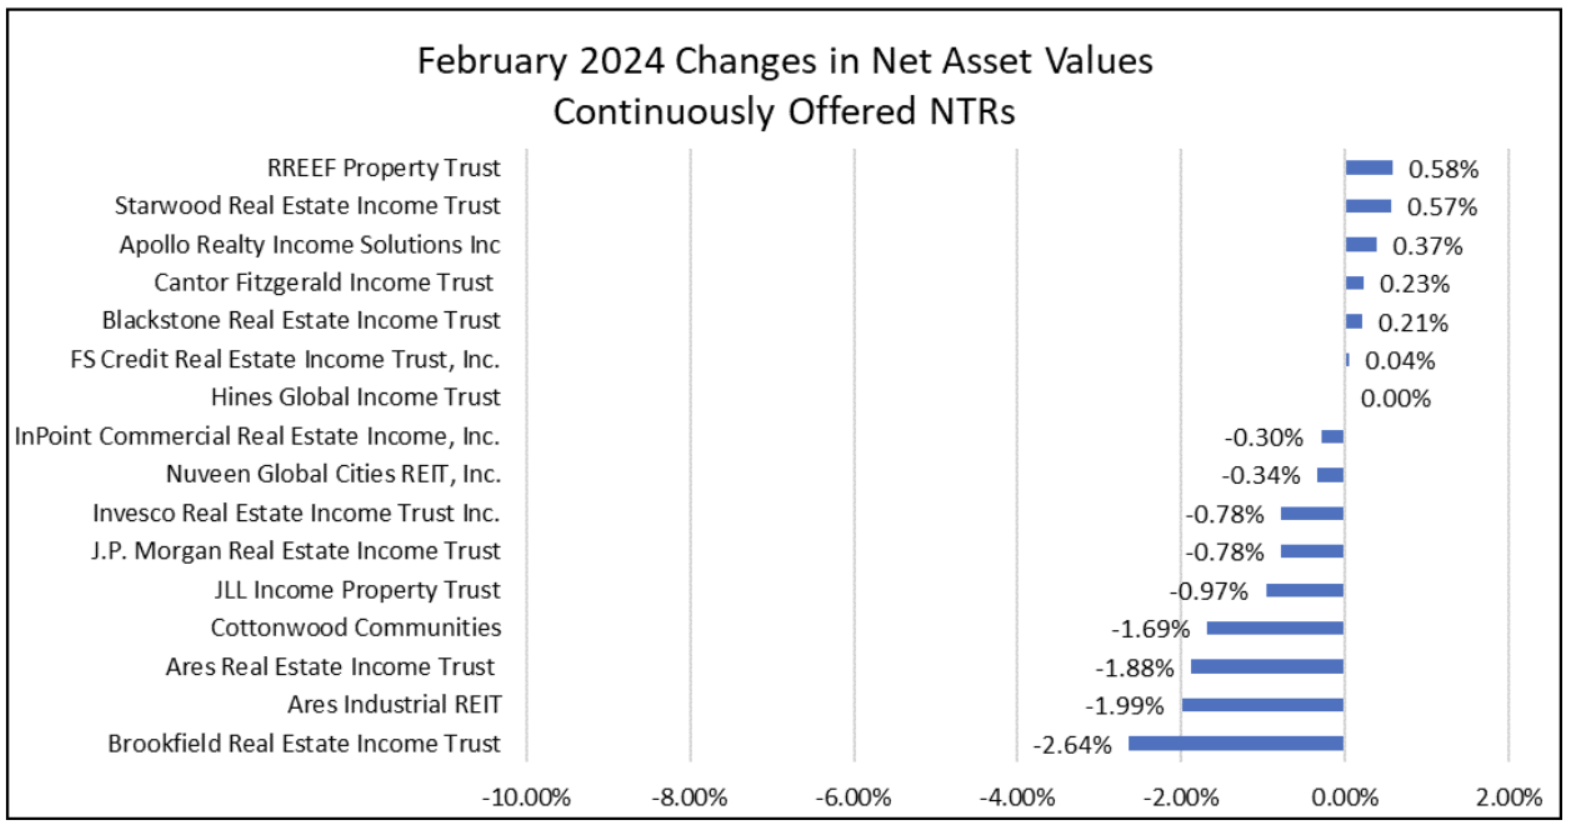
Nine of the sixteen continuously offered nontraded REIT programs reported declines in their Class I NAVs per share in February 2024. RREEF Property Trust had a 0.58% positive adjustment to its Class I NAV, along with Starwood REIT’s 0.57% increase, Apollo Realty Income Trust’s 0.37% and Cantor Fitzgerald Income Trust’s 0.23%. Blackstone REIT and FS Credit REIT also had increases. The median monthly change in NAV per share was negative 0.32%. This drop in NAVs per share resulted in total returns to shareholders with a median of 0.24% for the 16 REITs. Total returns include the monthly share of annualized distributions to the Class I shares, offsetting the losses in NAV per share.
Chart I
Brookfield REIT suffered the greatest decline in its NAV per share at negative 2.64%, resulting in a total return of negative -2.10%. Over the trailing 12-month period, BV estimated the total return to Brookfield REIT Class I shareholders at negative 8.24%, compared to the 16-REIT median total return over the same period of negative 5.28%.
Chart II
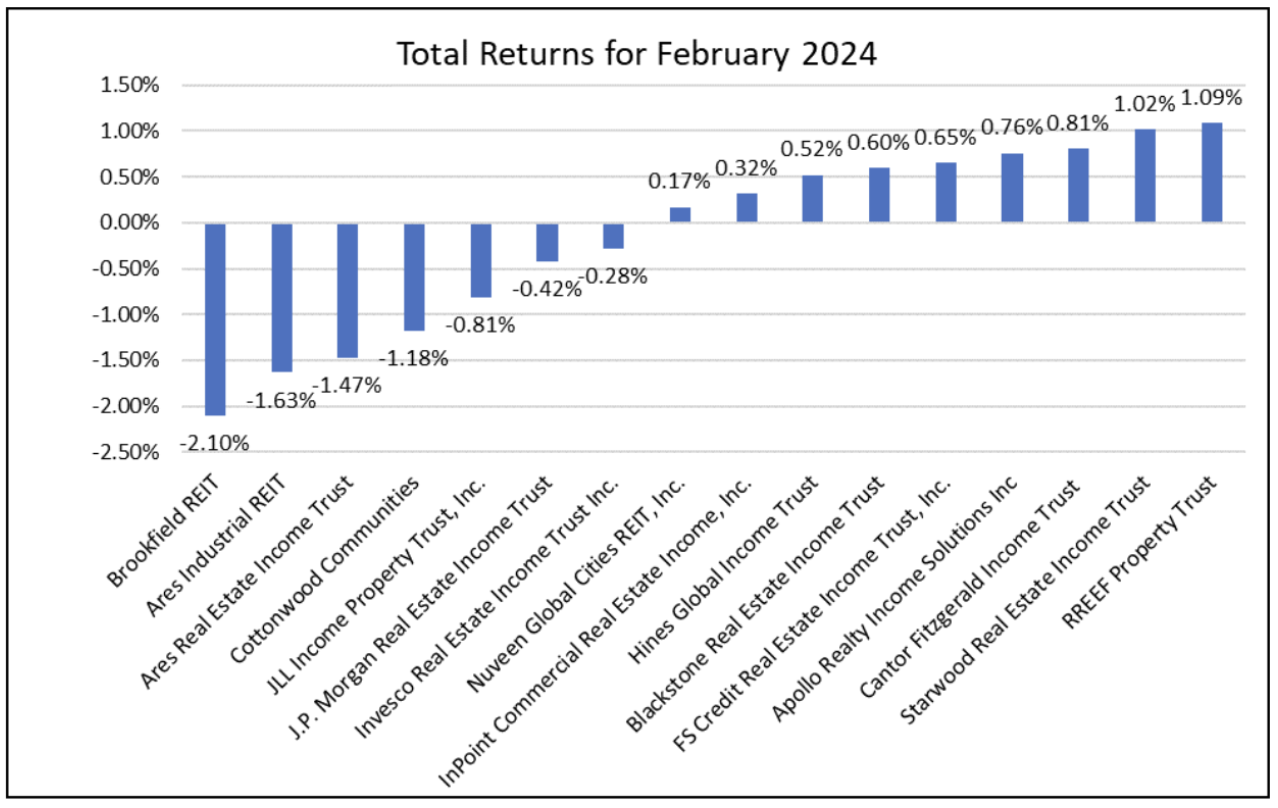
With a monthly pro-rated distribution rate, nine of the 16 NAV REITs had positive Class I shareholder returns in February 2024. The median total return for February for the group was 0.24%, an improvement over the prior month’s median total return of 0.07%. As seen in Chart I, RREEF Property Trust and Starwood REIT had the largest increases in Class I NAVs per share. Chart III shows the positive total returns for nine of 16 NAV REITs, with RREEF Property Trust and Starwood REIT leading the group.
Chart III
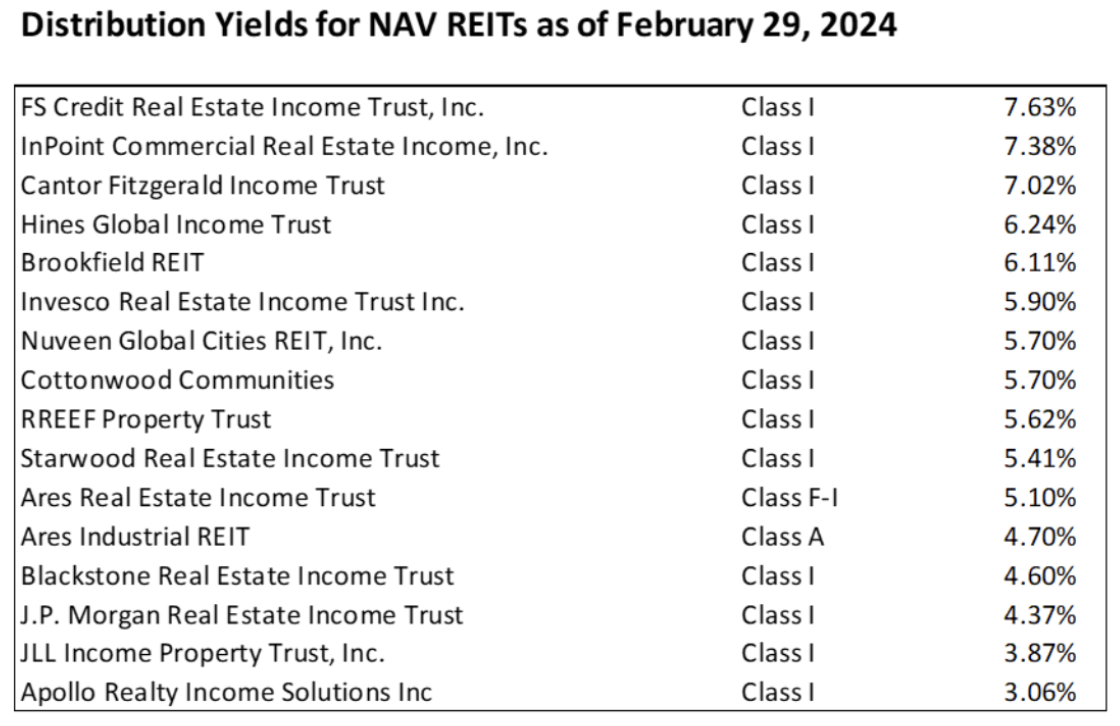
All of the NAV REITs were distributing cash to their Class I shareholders at rates far above the average dividend yield on the S&P 500 listed stock index (1.48% as of February 2024.) or the NAREIT All Equity REIT Index for listed REITs (4.12%). All but two NAV REITs had a distribution yield for Class I shares that exceeded the average distribution yield for listed REITs. The median distribution yield for the 16 NTRs was 5.66% as of February 29, 2024.
Table I
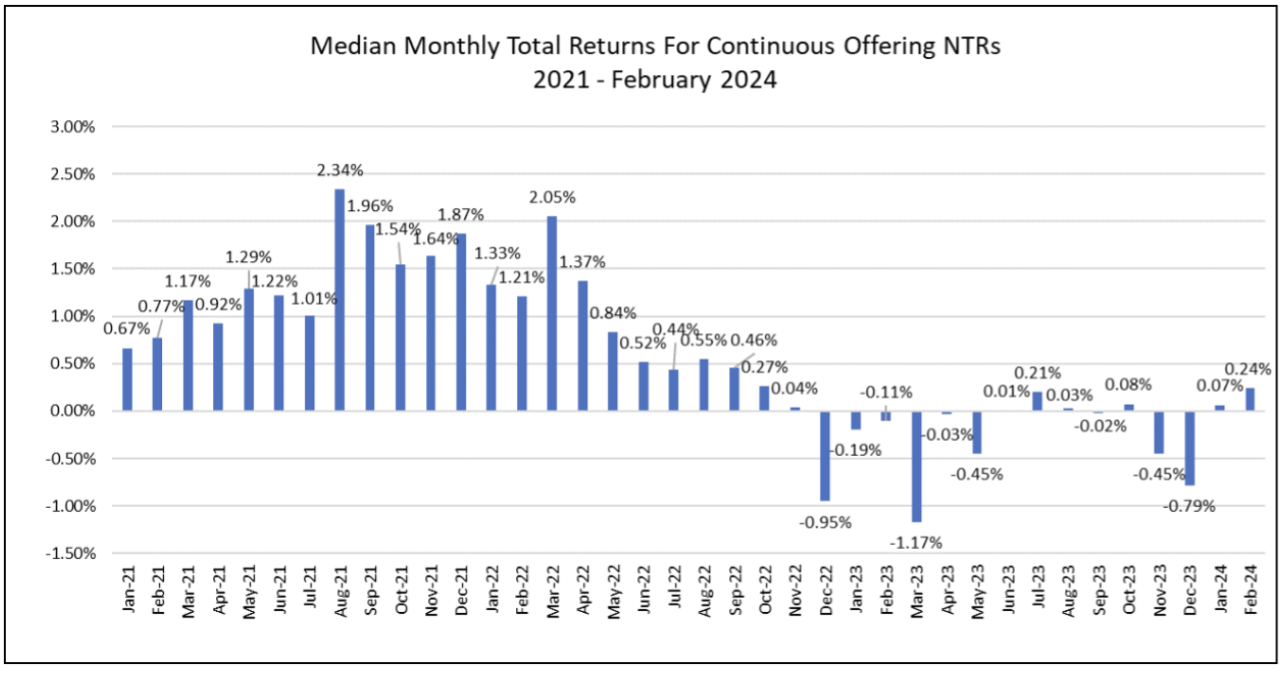
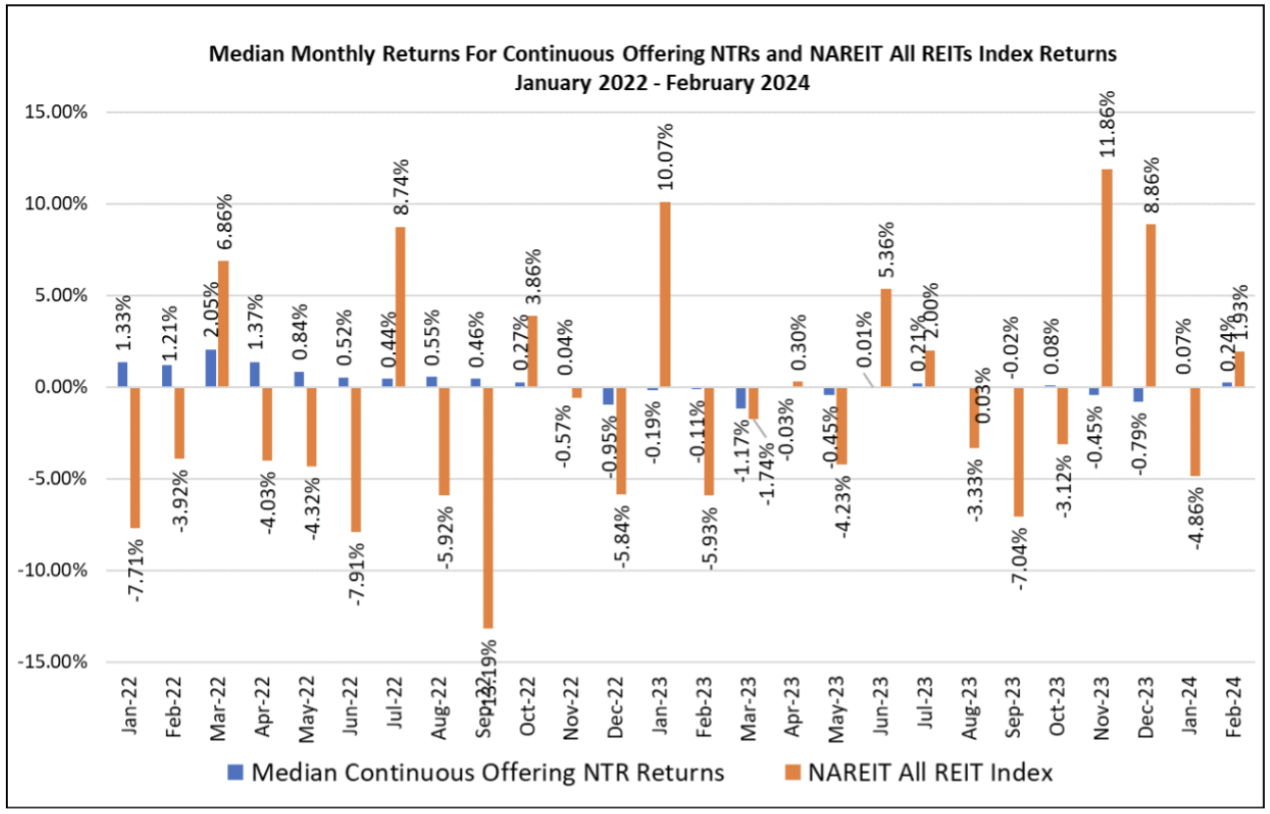
In November 2023, the median monthly total returns for the continuous offering NTRs turned negative for the first time since May 2023 and was negative again in December. Since January 2022, the median total returns for the nontraded REITs were negative nine out of 26 months. The S&P 500 Index had negative total returns for twelve of the 26 months. The listed REIT index had negative total returns in fifteen of the 26 months.
Chart IV
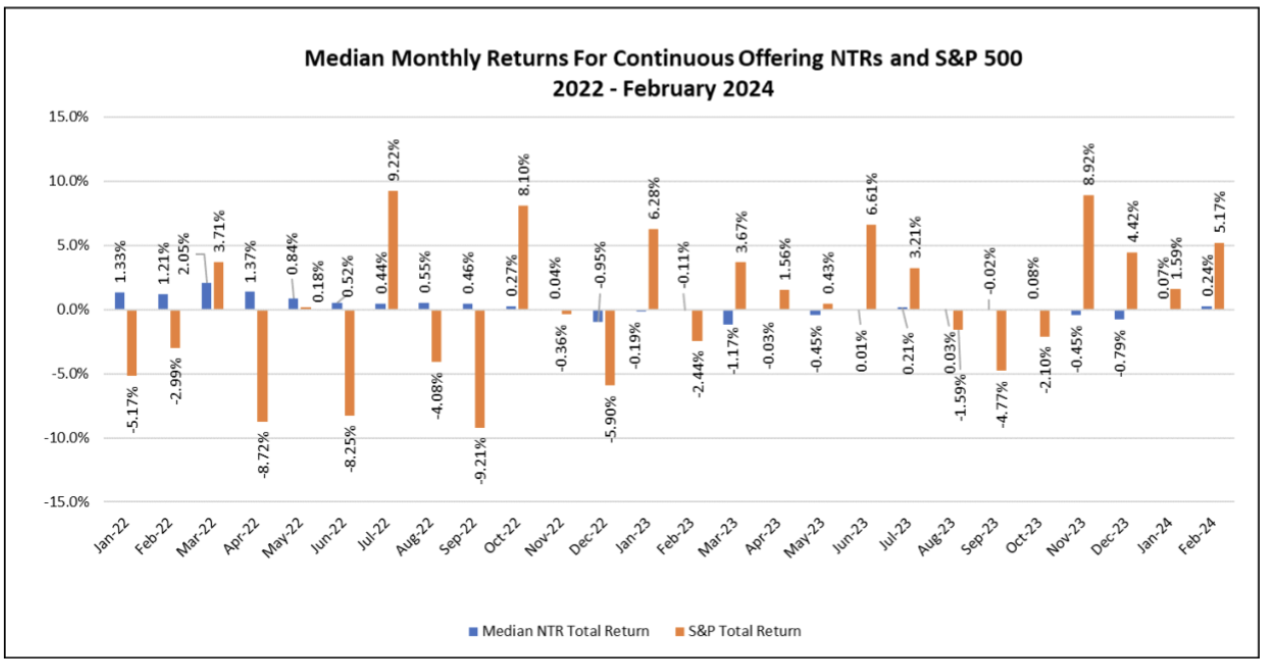
Chart V
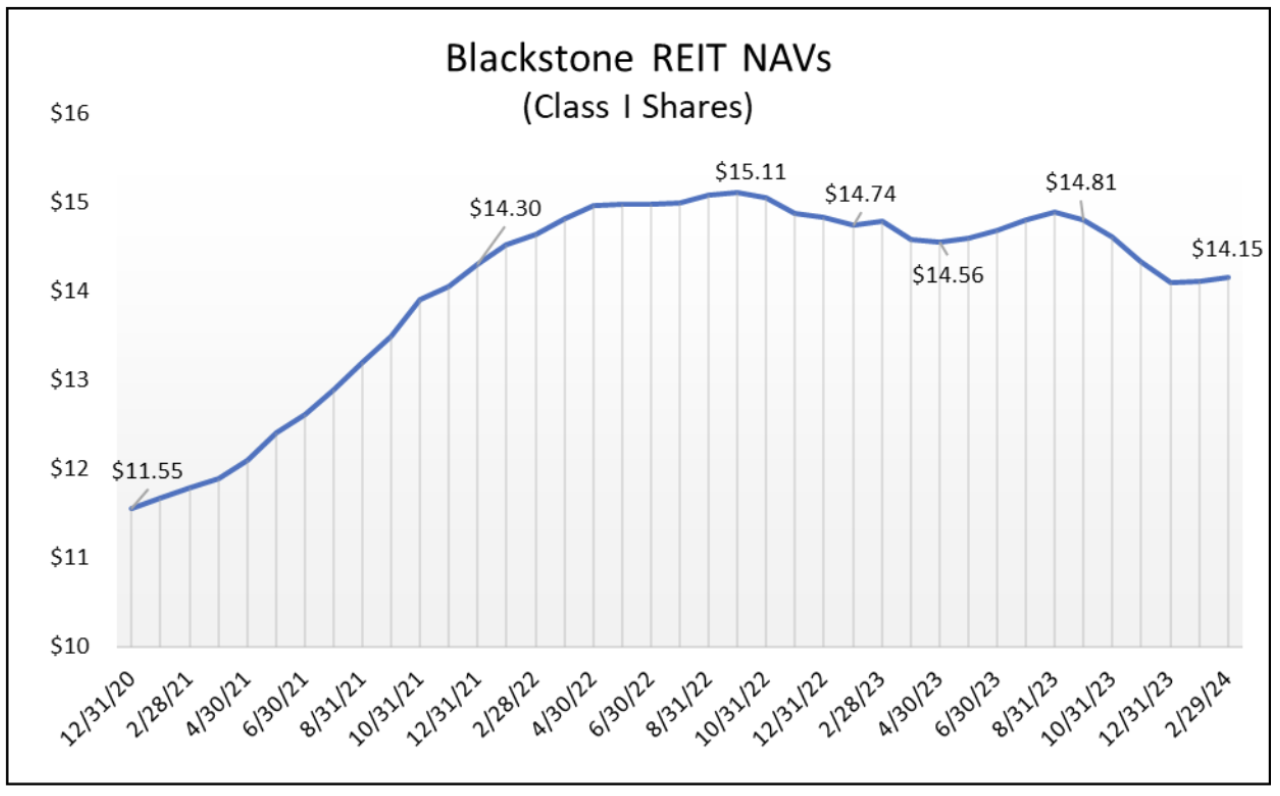
Blackstone REIT posted impressive increases in the net asset values per share from December 2020 until peaking in September 2022. From a high of $15.11 per share for its Class I shares, the REIT has suffered decreases in its NAV through 2023, reaching a low for the year of $14.10 as of December 31.
The slight increases in NAV for Class I shares in January and February are the first since August 2023. Blackstone REIs share redemptions began to exceed the 2.0% monthly percent of NAV caps in November 2023 and February 2024 was the first month since that all redemption requests were met. As the largest nontraded REIT by far, with over $60.7 billion in cumulative net asset value as of December 31, 2023, Blackstone REIT’s valuations are indicative of the trend across the sixteen continuously offered REITs.
Chart VI
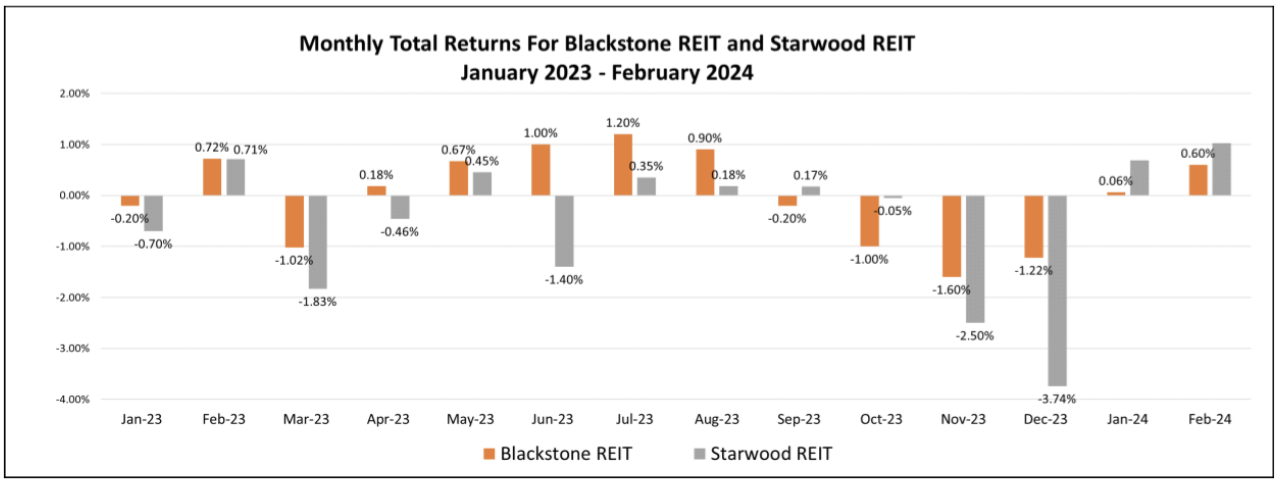
Starwood REIT, with over $10.3 billion in cumulative net asset value as of December 31, 2023, has also suffered significant declines in its NAV per share. During the fourth quarter of 2023 the REIT’s NAV per share declined 7.44%, compared to Blackstone’ REIT’s drop during the quarter of 4.79%. The resulting total returns for Starwood REIT and Blackstone REIT, offset by their distributions during the quarter, are shown below.
Chart VII
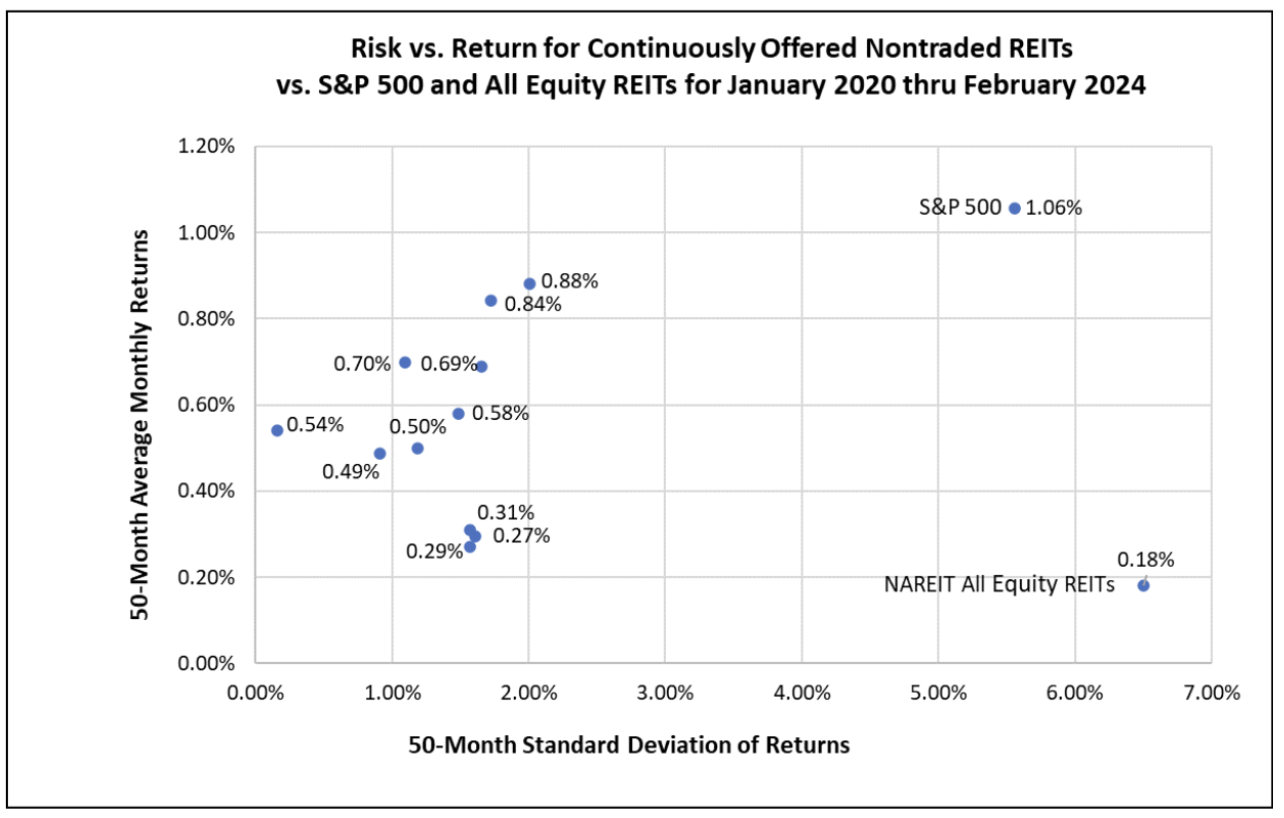
The story of total returns over the past 50-month period earned by investors in continuously offered nontraded REIT shares is not complete without also considering the month-to-month volatility of those returns. The standard deviation of the median monthly returns for investors in these nontraded REIT products was just 0.77%, and the average monthly return was 0.55%. Compared to the standard deviation of the monthly returns to the S&P 500 of 5.56% over the same 50-month period, and the standard deviation of the monthly returns to the All Equity REIT Index for listed REITs of 6.50%, the nontraded REIT returns are much less volatile than both listed stocks and listed REITs, while recording much higher distribution yields.
Chart VIII
Sources: Blue Vault, SEC, individual REIT websites, NAREIT and S&P