Johnathan Rickman | Blue Vault
Distribution coverage continued to be a challenge for sponsors of nontraded REITs in the third quarter of 2025, compounding the industry’s ongoing struggles to raise capital and boost asset levels, Blue Vault data shows1.
Based on the offerings tracked by Blue Vault, median payout ratios for funds from operations (FFO) rose slightly for open nontraded REITs to 132% from 127% the previous quarter and 123% in Q1 2025. When this metric, an accrual measure of profitability, rises above 100%, it typically indicates the REIT’s income isn’t enough to cover its distributions.
These results come at a crossroads moment for the nontraded REIT industry. While some industry leaders predict a minor real estate revival this year, citing the sector’s current mix of product constraints and positive cash flows, alternative investment firms have begun launching Delaware statutory trust programs to indirectly boost REIT inflows and interest.
There were some bright spots for the industry in the third quarter of 2025. Leverage use or not, median distribution yields continued to hold steady in the 5% range, and median debt ratios continued to decline.
Let’s take a closer look at the data for additional perspective.
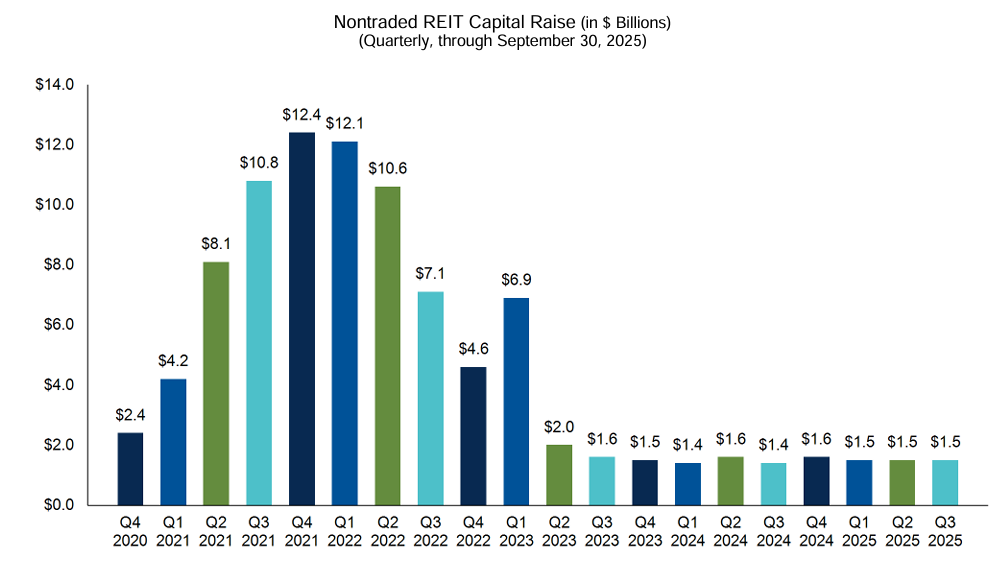
Capital Raise
The nontraded REIT industry raised approximately $1.46 billion in public funds in the third quarter of 2025, down from the $1.53 billion raised in Q2 2025 and from the $1.50 billion raised in Q1 2025. Private fundraising told a similar story. The industry raised $1.10 billion in Q3 — up from $0.95 billion the previous quarter but down from $1.37 billion in Q1 2025.
Blackstone Real Estate Income Trust has dominated the sector since it was introduced in 2016. Blackstone led the sector with $786.0 million in public capital raise in Q3 2025 for a 53.7% market share, having raised an estimated total of $83.3 billion since inception.
Other top capital raisers, since inception and as of September 30, 2025, include runner-up FS Credit REIT ($144.4 million), Hines Global Income Trust ($130.6 million), Apollo Realty Income Solutions ($121.9 million), and Nuveen Global Cities REIT ($104.6 million).
All nontraded REITs had $3.97 billion in cash on their balance sheets as of September 30, 2025, to help fund future acquisitions and redemptions, which is in line with total cash as of June 30, 2025. Among open REITs, those actively raising capital, this total was $3.24 billion as of September 30, 2025, compared to $3.44 billion in cash among the open REITs as of June 30, 2025.
Asset Levels
As of September 30, 2025, the nontraded REIT industry had $174.1 billion in assets under management, down from $178.0 billion the previous quarter and $184.3 billion in Q1 2025.
Unsurprisingly, Blackstone REIT also leads the sector in this metric, managing $104.1 billion as of September 30, 2025, making up 59.8% of the industry’s total. Starwood REIT came in second, reporting total assets of $19.2 billion for 11.0% of the industry’s total. FS Credit REIT was once more the third-largest REIT with assets totaling $11.4 billion.
For the last several quarters, asset levels for nontraded REITs have fallen while rising2 for nontraded BDCs:
| Reporting Period | Nontraded REIT AUM $(B) | Nontraded BDC AUM ($B) |
| Q1 2025 | $184.3 | $193.9 |
| Q2 2025 | $178.0 | $212.2 |
| Q3 2025 | $174.1 | $229.6 |
Distributions
A consistent bright spot for the industry has been median distribution yields (Class A or Class T) for open REITs, which have held steady in the 5% range for the last 4 quarters:
| Reporting Period | Median Distribution Yield |
| Q4 2024 | 4.94% |
| Q1 2025 | 5.06% |
| Q2 2025 | 5.00% |
| Q3 2025 | 5.06% |
However, maintaining these yields has come at a cost, namely leverage. Median FFO payout ratios for open REITs have been over 120% over the last four quarters, reaching as high as 177% in the fourth quarter of 2024.
The industry’s distribution coverage woes are also observable at the individual product level. For instance, Blackstone REIT’s quarterly AFFO payout ratio came in at 208% in Q3 2025, the highest ratio since its quarterly payout ratio of 240% in Q3 2024. The offering’s debt-to-total-assets ratio was also highly levered at 57.1% in the third quarter of 2025. 20.7% of the REIT’s debt matures before 2027, and 20.1% is at unhedged variable rates, indicating a need for refinancing and some interest rate risk.
The industry’s median debt ratios for open REITs have fallen steadily over the last four quarters, however, dropping from 48% in Q4 2024 to 40% in the third quarter of 2025.
“Real due diligence happens below the surface,” said Blue Vault CEO Stacy Chitty. “While there’s no substitute for independently sourced performance data, connecting with and getting to know product sponsors is also just as crucial for cutting through the noise and making informed investment decisions,” he added.
Industry Outlook
If 2025 was the year of private credit, what does 2026 portend for the universe of alternative investments? Many industry experts are cautiously setting their sights on private real estate, pointing to market shifts impacted by falling rates and strong occupancy levels.
According to Nareit, the U.S.-based trade group for REITs and publicly traded real estate companies, REIT occupancy rates were greater than their respective Open End Diversified Core Equity occupancy rates across property types except industrial in Q3 20253.
But as investor interest in private real estate regains traction, due diligence will continue to be paramount as markets continue to shift.
“Heading into 2026, advisors should pay close attention to how investor distributions are being funded,” said Joshua Ungerecht, Managing Partner at ExchangeRight. The California-based firm’s privately offered Essential Income REIT has maintained full coverage of its dividend from operating cash flows since inception.
“Blue Vault’s median payout ratios indicate that the majority of REITs are paying distributions that exceed operating cash flows, requiring the dilutive use of investor equity or increasing debt,” Ungerecht noted. “At ExchangeRight, we work to avoid this by focusing on necessity-based and recession-resilient industries and tenants, reinforcing our emphasis on income stability amid economic uncertainty,” he added.
Don’t Go It Alone
Learn about Blue Vault membership and how our performance data can help protect your clients, and as such, your advisory practice. Our research includes historical and current data on nontraded REITs, nontraded BDCs, interval funds, tender offer funds, and preferred share stock. Our coverage also includes capital market overviews, financing outlooks, individual performance profiles, and updates on product launches and full-cycle events.
With the launch of Blue Vault’s new portal in the next two weeks, wealth advisors can sort, filter, and analyze private credit and private real estate offerings like never before.
Are you an asset manager, broker-dealer, or other firm serving the alts industry? Contact us today to view a full demo of our unparalleled research offerings.
References
1 Blue Vault Nontraded REIT Industry Review: Third Quarter 2025
2 Blue Vault Nontraded BDC Industry Review: Third Quarter 2025
3 REITs Present Buying Opportunity for Investors that Appreciate Good Value | Nareit, 11/24/2025