Nontraded REIT Industry Review – LifeStage™ Summary
January 12, 2017 | by Laurie Brescia | Blue Vault

In each quarter’s Nontraded REIT Industry Review you will find… a host of Nontraded REIT Industry data and charts preceding the individual REIT pages.
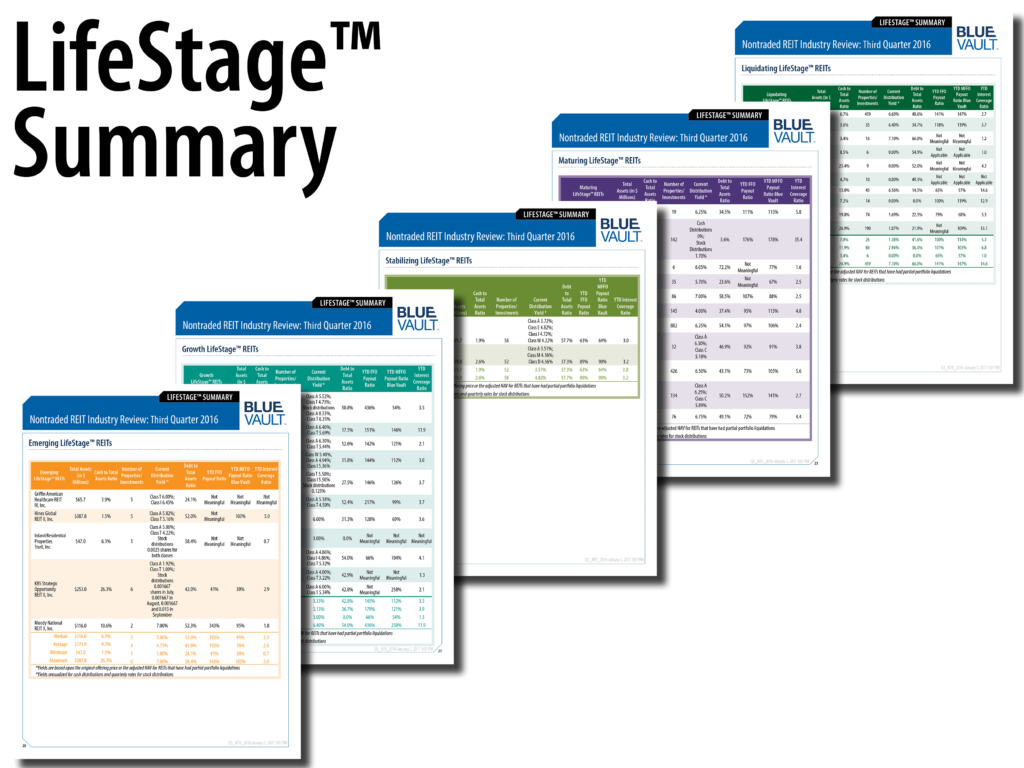
Some of the data is in the “LifeStage™ Summary”.
In the Q3 2016 Review:
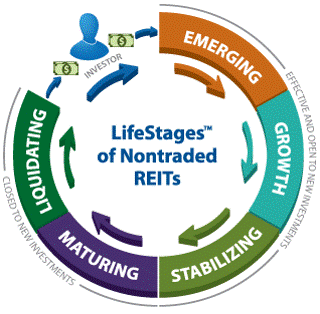
- Five REITs were Emerging
- Eleven REITs were Growth
- Two REITs were Stabilizing

- Thirty-seven REITs were Maturing
- Ten REITs were Liquidating
In the review there is a table for each LifeStage listing each REIT in that LifeStage and the following facts:
- Total Assets (in $ Millions)
- Cash to Total Assets Ratio
- Number of Properties/Investments
- Current Distribution Yield
- Debt to Total Assets Ratio
- YTD FFO Payout Ratio
- YTD MFFO Payout Ratio Blue Vault
- YTD Interest Coverage Ratio
For each of these metrics Blue Vault also calculates the Median, Average, Minimum, and Maximum and lists them at the end of each table.
See pages 20-26 of the Nontraded REIT Industry Review, Third Quarter 2016, for details such as this, as well as assets under management, average yield, number of funds that are currently raising capital, and more.
[i4w_onlyfor tagid=’1500′] Click here to download the Nontraded REIT Industry Review Q3 2016 – LifeStage™ Summary now. [/i4w_onlyfor]


