Nontraded REIT Offerings Report Positive Average Returns for 29th Consecutive Month
October 25, 2022 | James Sprow | Blue Vault
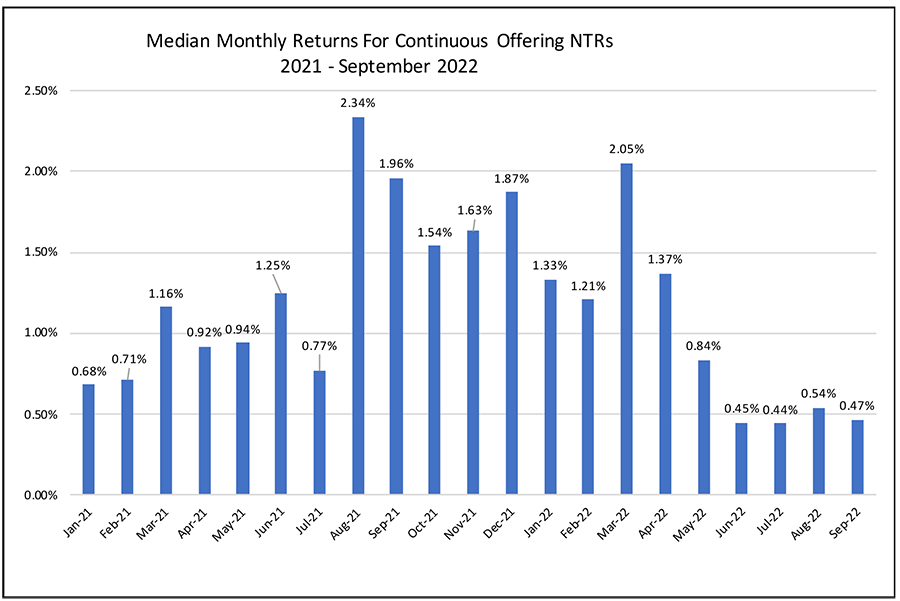
While the total monthly returns on both the S&P 500 Index and the NAREIT All REIT Index have fluctuated wildly over the past 33 months, the average returns on the continuously offered nontraded REITs (“NAV REITs”) have had an average negative return in only two months of the last 33 months. Those two months, March and April 2020, were clearly impacted by the onset of the COVID pandemic. The S&P 500 Index, by comparison, had negative total returns in 14 of 33 months since January 2020. The NAREIT All REITs Index also had negative total returns in 14 of 33 months. From January 2021 thru September 2022, the median monthly total returns for the continuous offering NTRs were consistently positive.
Chart I

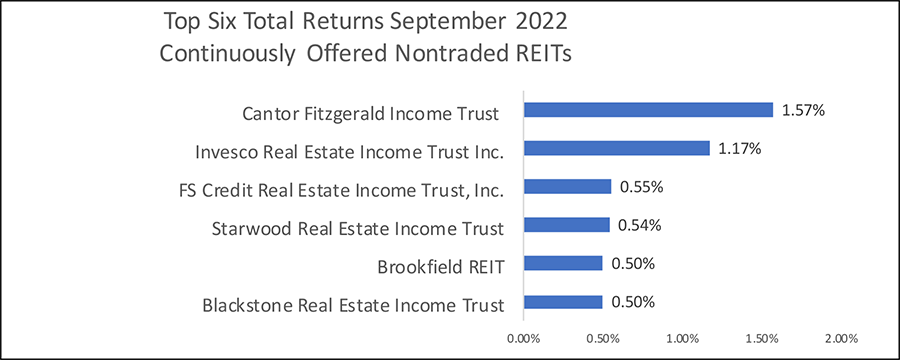
The top six NAV REITs with total returns for September 2022 are shown below.
Chart II

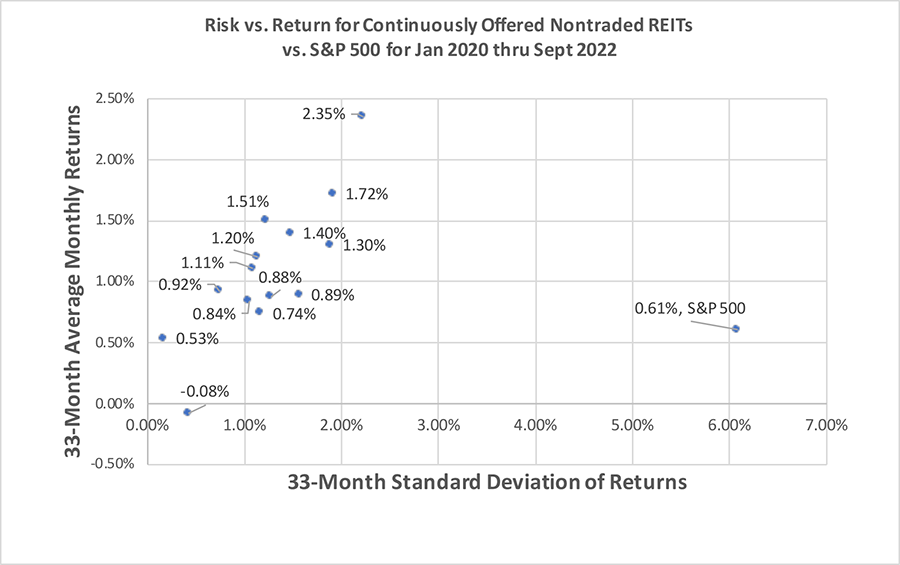
Not only have the 14 NAV REITs outperformed the S&P 500 Index in their average monthly total returns and median monthly total returns, but the volatility of those returns have also been dramatically lower. Using the standard deviation of returns over the past 33 months as the measure of volatility, the NAV REITs have provided returns that exceed the S&P 500 return for 12 REITs with dramatically lower standard deviations of monthly returns for every NAV REIT. The chart below plots the average returns on the vertical axis vs. the standard deviations of those monthly returns on the horizontal axis.
Chart III

Sources: Individual NTR Websites


