Nontraded REITs Compare Favorably When Market Volatility Increases
January 13, 2021 | James Sprow | Blue Vault
 In the history of the nontraded REIT industry, it has been difficult to make a case for the stability of REIT pricing compared to listed REITs because the traditional REIT structures did not allow frequent valuations and estimated NAVs per share. Now that more nontraded REIT offerings are continuous and offer monthly or even daily estimates of NAVs, the relative volatility of those values compared to market pricing for listed REITs can be documented.
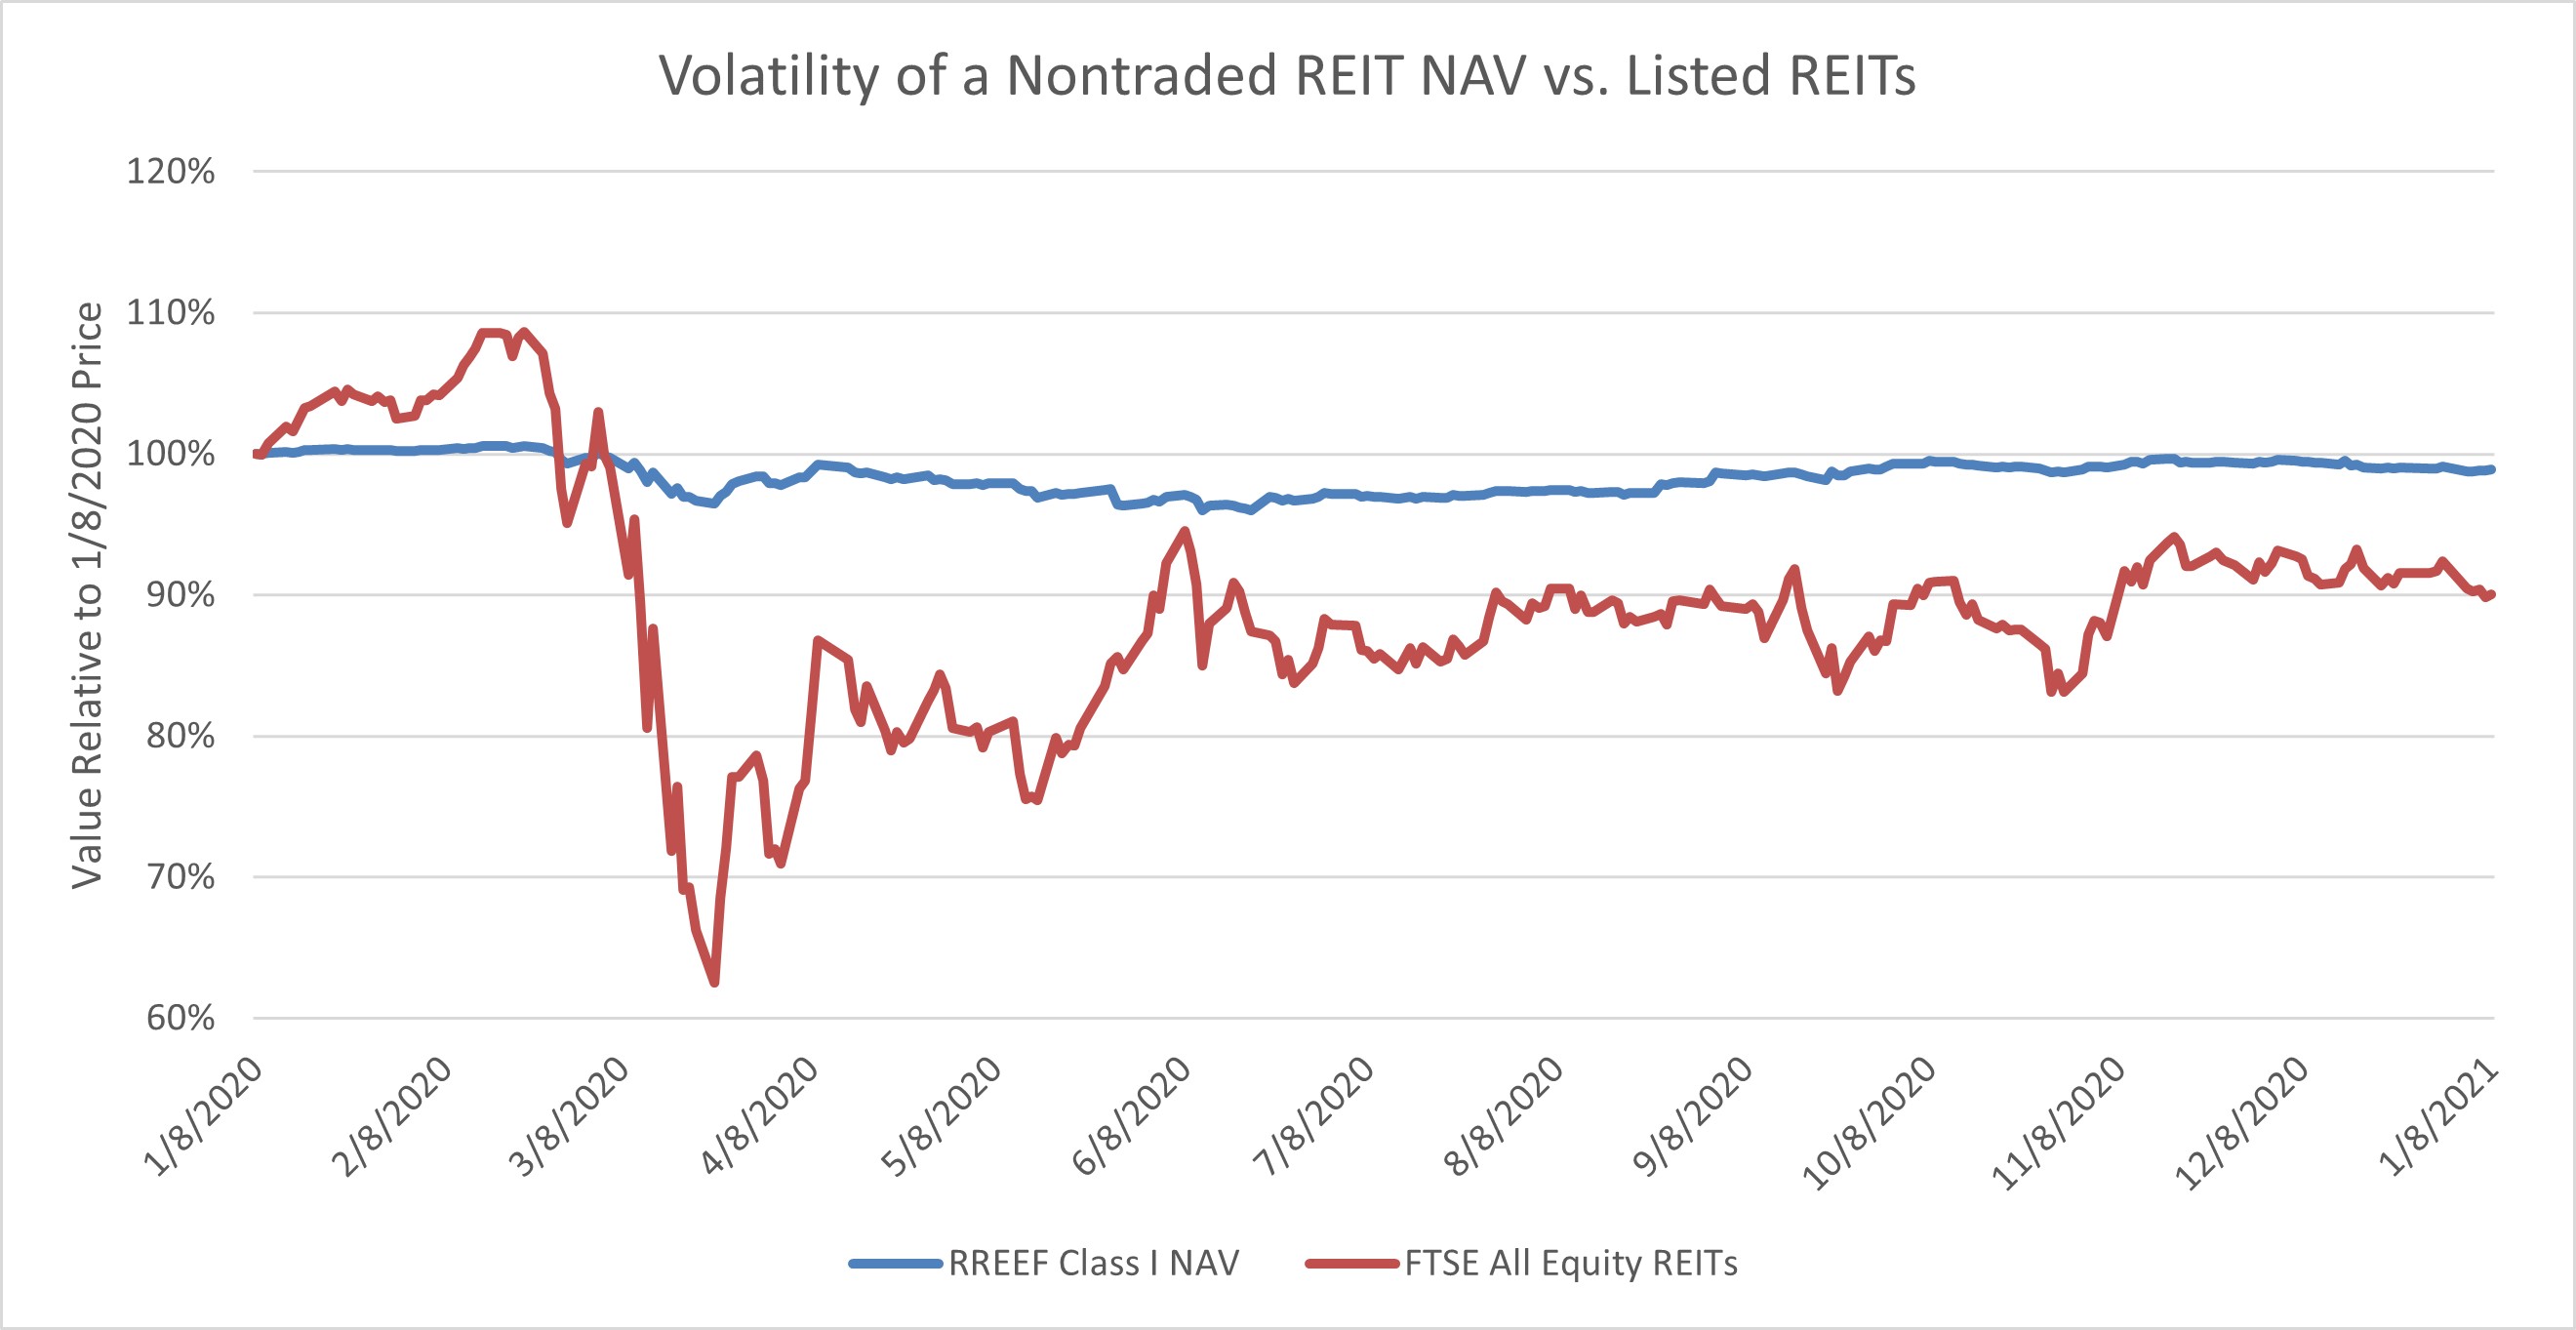
One simple example that illustrates the differences between estimated NAVs for nontraded REITs and listed REIT pricing is shown below. The NAV data is for RREEF Property Trust Class I shares and the listed REIT pricing is for the FTSE Nareit All Equity REIT Index. The FTSE Nareit All Equity REITs Index is a free-float adjusted, market capitalization-weighted index of U.S. equity REITs. Constituents of the index include all tax-qualified REITs with more than 50 percent of total assets in qualifying real estate assets other than mortgages secured by real property. It is important to remember that a diversified index of all equity REITs is likely to have less volatility than the individual REITs making up the index. Removing the diversification effect means that a comparison with individual listed REIT prices would likely magnify the differences in volatility.
In the chart below, the NAVs announced daily for RREEF Property Trust Class I shares are shown, with changes relative to the beginning price as of January 8, 2020, expressed as a percentage of the beginning price. The FTSE Nareit All Equity REIT Index pricing is also expressed as a percentage of its value as of January 8, 2020. Over the one-year period of data, the nontraded REIT’s daily NAVs varied from a maximum of 55 bps higher than the beginning price to 399 bps lower. A total range of 4.54%. The FTSE Nareit All Equity Index price varied from 8.63% higher than its beginning value to 37.47% lower, a total range of 46.09%. In other words, the volatility of the All Equity REIT Index pricing was over 10 times the variability of the NAVs for the nontraded REIT.
With nontraded REITs, one criticism is the lack of liquidity. However, the new breed of continuously offered nontraded REIT products all offer increased liquidity options. For example, RREEF Property Trust offers to redeem in any given quarter up to 5% of REIT’s combined NAV for all classes of shares at the REIT’s NAV per share of the class of shares being redeemed, subject to a short-term trading discount, if applicable. This means that the redemption prices available to shareholders do track the daily NAVs for the REIT’s shares. Over the four-quarter period from Q4 2019 through Q3 2020, RREEF Property Trust redeemed approximately 9.6% of its weighted average outstanding shares and 1.42% in Q3 2020. This represents significant liquidity available to shareholders. At a time when listed REIT shares were over 30% below their beginning value in 2020, this ability to redeem nontraded REIT shares at the estimated net asset value is a valuable feature.
The RREEF Property Trust NAV history illustrated above is not an unusual case. There are currently 13 nontraded REIT programs with frequent NAV announcements. Two of those REITs have daily NAVs and 11 have monthly NAVs. The variation in monthly NAVs have all been within a relatively narrow range. For example, Starwood REIT had only one month of negative returns for its Class I shares as measured by the change in NAV plus distributions yield during the 12 months from December 2019 thru November 2020. The relative stability and improved liquidity for investments in continuously-offered nontraded REITs has been a strong selling point.
Sources: SEC, Yahoo Finance, Individual REIT websites