Nontraded REITs With Increased Net Asset Values per Share
June 10, 2021 | James Sprow | Blue Vault
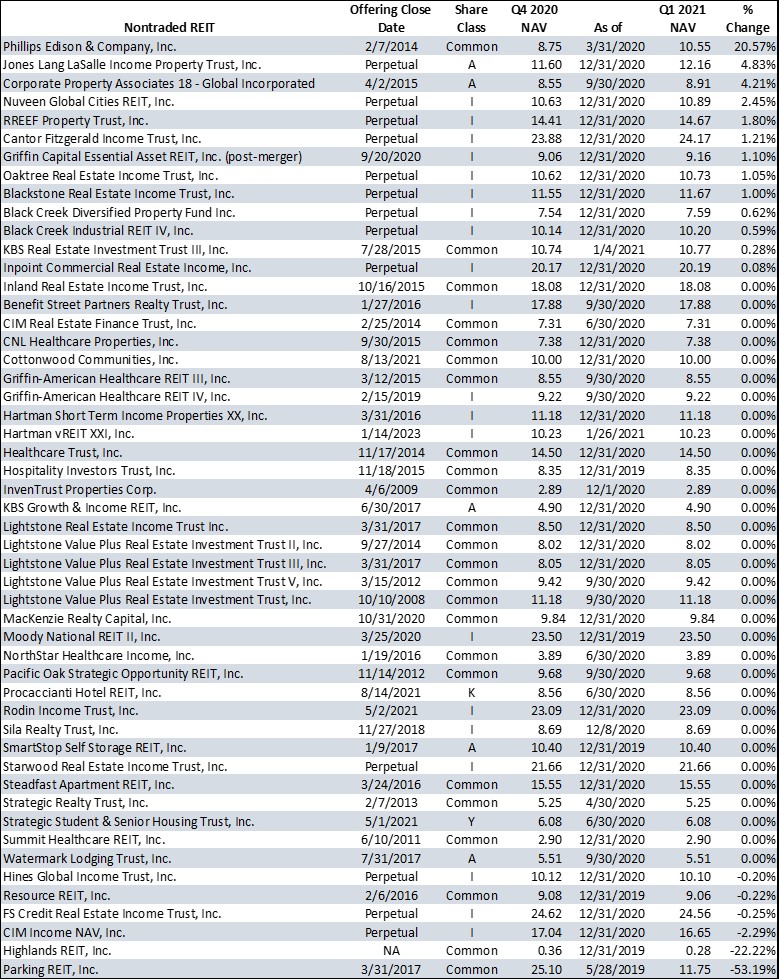
 Thirteen nontraded REITs had increased net asset values per share from those published as of December 31, 2020, to the end of Q1 2021 on March 31, 2021. One nontraded REIT, Phillips Edison & Company, Inc. had an estimated net asset value per share as of March 31, 2021, up 20.6% from the value per share of $8.75 as of March 31, 2020, to $10.55 as of March 31, 2021. Nine REITs with perpetual offerings had increases in their NAVs as of March 31, 2021, from the NAVs as of December 31, 2020. The perpetual offerings announce updated NAVs either each month or each quarter. The increases of these NAVs for perpetual REITs ranged from 4.83% for Jones Lang LaSalle Income Property Trust, Inc. to just 0.08% for InPoint Commercial Real Estate Income, Inc.
There were six nontraded REITs that had lower NAVs per share as of March 31, 2021, compared to those NAVs as of December 31, 2020 or an earlier as-of date. Parking REIT saw its NAV per share fall from $25.10 as of May 28, 2019 to $11.75 as of March 31, 2021. Highlands REIT, Inc. had a 22.2% decline in its common share net asset value from $0.36 per share to $0.28 per share. Three perpetual offerings had declines ranging from -.2.29% for CIM Income NAV Class I shares from $17.04 as of December 31, 2020, to $16.65 as of March 31, 2021, to just -0.20% for Hines Global Income Trust, Inc. at $10.12 as of December 31, 2020, to $10.10 as of March 31, 2021.
The table below shows the changes in estimated NAVs for 51 nontraded REITs from Q4 2020 to Q1 2021. Of those, 32 REITs reported no changes in their NAVs from quarter to quarter.
Source: Blue Vault