October Total Returns to Continuously Offered NTRs Lowest Since March 2020
November 23, 2022 | James Sprow | Blue Vault
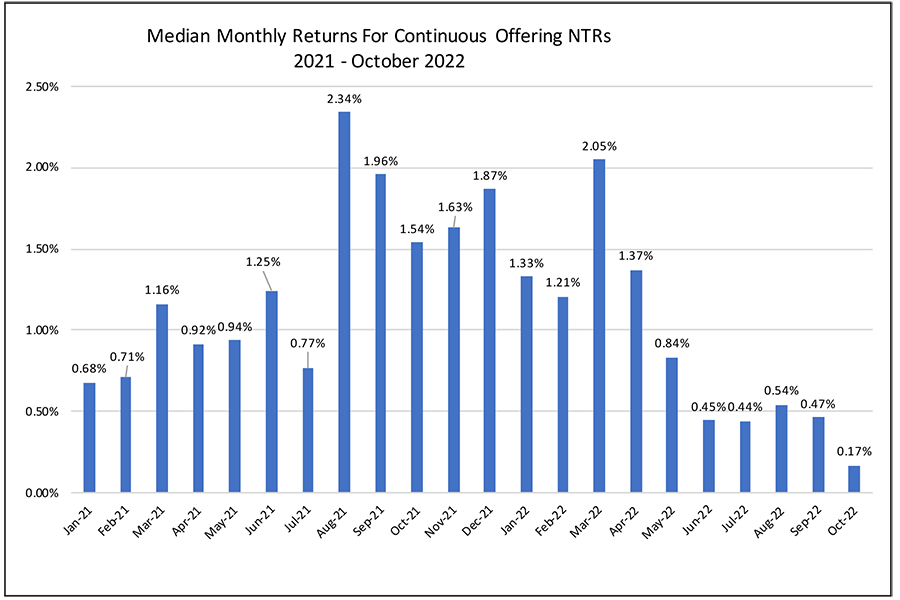
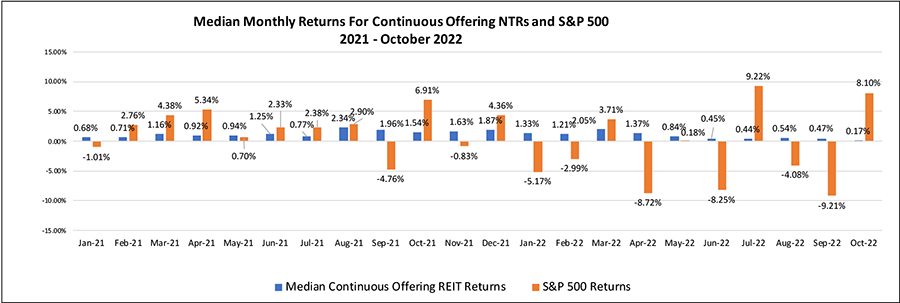
The 14 continuously offered nontraded REIT programs posted the lowest median returns for the group since March 2020, the beginning of the COVID-19 pandemic. The median total return, calculated as the sum of the percentage change in the NAVs per share and the monthly distribution yield, was still positive at 0.17%, down from 0.47% in September. The total returns YTD thru October had a median of 10.09%, comparing very favorably to the total returns to the NAREIT All REIT Index of -12.86% and the S&P 500 of -17.70%.
Chart I
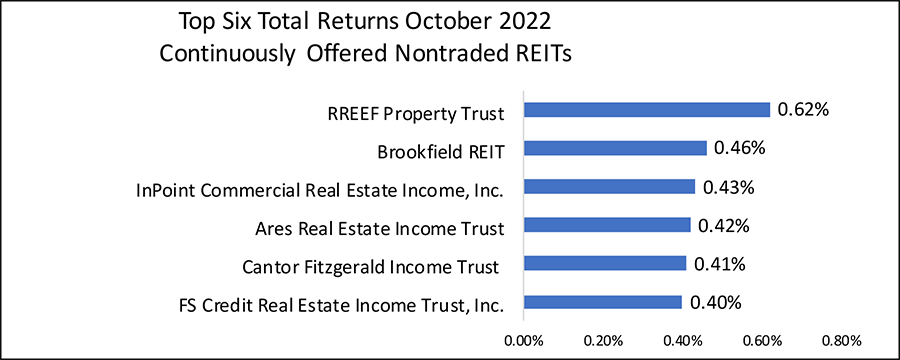
For the month of October 2022, the highest total return was for RREEF Property Trust with a return of 0.62%, followed by Brookfield REIT at 0.46% and InPoint Commercial Real Estate Income at 0.43%. October saw 11 of the 14 REITs with positive total returns ranging from the 0.62% for RREEF to -0.82% by Invesco REIT.
Chart II
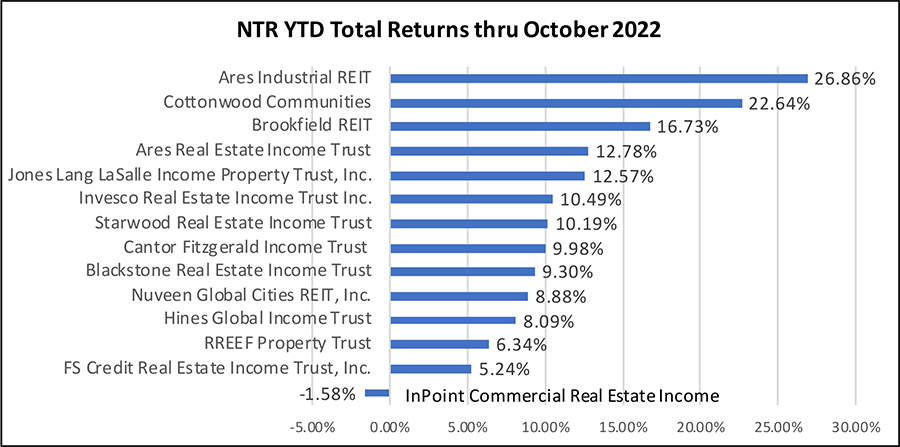
The highest total return YTD thru October was recorded by Ares Industrial REIT at 26.86%, followed by Cottonwood Communities at 22.64% and Brookfield REIT at 16.73%. Only one continuously offered REIT had a negative total return thru October, InPoint Commercial Real Estate Income with a return of -1.58%.
Chart III
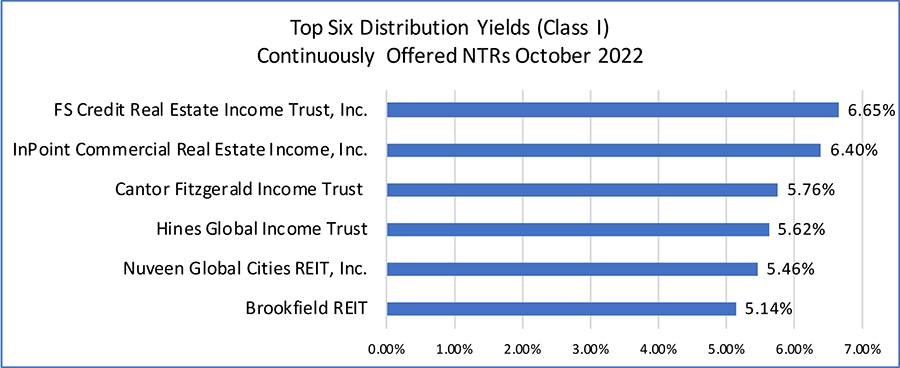
The average distribution yield for the 14 NTRs was 4.86% in October 2022. This means that roughly 0.40% is the income component of the median monthly return of 1.02%, and 0.62% is due to appreciation of the REITs’ NAVs per share over the last 12 months.
Chart IV
Comparing the median total returns for the NAV REITs to the performance of the S&P 500 Index for listed common stocks, we observe that in no since March 2020 has the median total return for the NAV REITs been negative. For the S&P 500 Index, there have been nine months in the last 22 with a negative total return.
Chart V
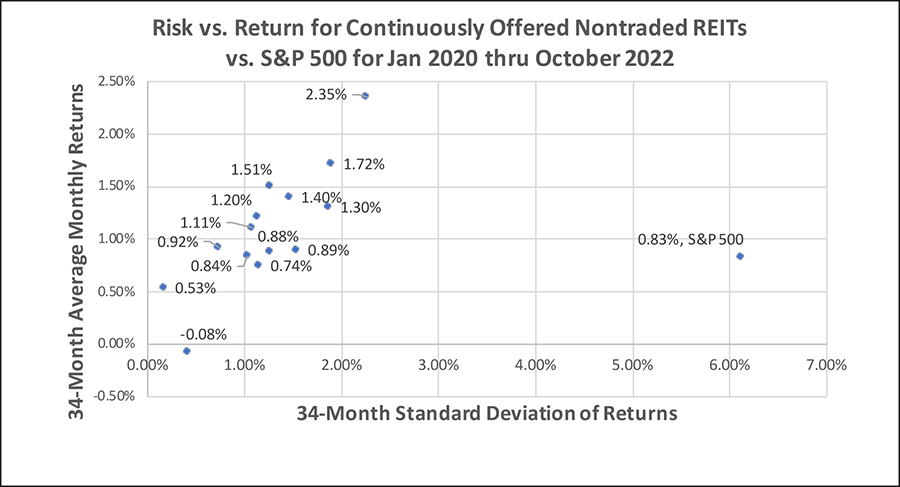
In terms of risk, the standard deviation of the monthly median returns for the NAV REITs over the last 34 months was 0.60%. The standard deviation of the S&P 500 monthly returns over the same period was 6.12%, or roughly 10 times the risk according to this commonly used metric. The correlation of the NTR monthly returns with the monthly returns of the S&P 500 Index over the last 34 months was a miniscule 0.068. This lack of correlation is another strong indicator of the value of using the continuously offered nontraded REITs in a diversified portfolio to reduce risk.
Sources: Individual REIT websites; Blue Vault