Recent Performance of a Nontraded REIT’s NAV vs. Listed REITs
November 10, 2022 | James Sprow | Blue Vault
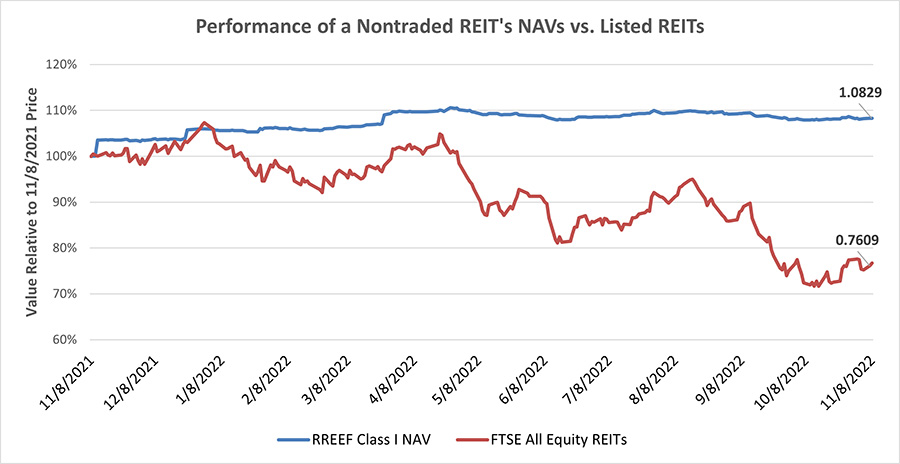
One of the advantages of nontraded REIT investments is the lower volatility of valuations compared to listed REITs. The market value of listed REITs as indicated by the FTSE All Equity REITs index has fallen approximately 24% from November 8, 2021, to November 8, 2022. For comparison purposes, we will use the daily NAVs published by RREEF Property Trust, a continuously offered nontraded REIT. (Unlike most continuously offered nontraded REITs that publish NAVs monthly, RREEF Property Trust provides daily revisions to NAVs per share.) Using the daily valuations published by RREEF Property Trust Class I shares, the change in values over the same time period was an increase of approximately 8%. Not only has the NAV of the RREEF Property Trust Class I shares outperformed the listed REITs index by 32%, but the volatility of the two series reveals a significant difference. The standard deviation of daily changes in the RREEF share NAVs was 0.31% for the year. The standard deviation of daily changes in the listed REIT index was 1.42%, a difference of over 4.6X over the same time period.
Investors in nontraded REITs value both the returns these products provide, reflected in their distribution yields and their changes in NAVs per share over time, and the lower volatility of those returns. Lower rates of return with lower volatility of returns might be a preferable trade-off for an investor, depending upon their tolerance for risk. In the case of RREEF Property Trust over the last year, investors had both higher returns and lower volatility.

Another metric that investors use to construct their investment portfolio is the correlation of returns from an investment choice with the broader market. In the chosen example, the correlation coefficient for the daily changes in NAVs for RREEF Property Trust and the FTSE All Equity REITs Index was a relatively low 0.27. This low correlation with listed REITs indicates that adding the nontraded REIT shares to a diversified portfolio would have raised average returns, lowered volatility, and reduced the portfolio’s risk.
Sources: www.rreefpropertytrust.com; Finance.Yahoo.com


