Shifts in Credit Markets Highlight Importance of Active Management
Fundamental changes in today’s credit markets are occurring in the later stages of the business cycle, a situation that puts investors’ appetite for risk back under the spotlight. The balancing act becomes more challenging in a low-yield, late-cycle environment, where investors need fixed income to generate income-based returns and protect portfolios from inevitable market volatility.
We believe an increased deterioration and dispersion of credit quality, coupled with the obstacles facing traditional fixed-income investors, underscore the importance of active management supported by a defined process to distinguish between improving and weakening credits. Even better, we believe that active managers of fund structures that match the liquidity composition of their underlying assets may reduce, if not eliminate, the most important late-cycle risk: liquidity risk. These managers have more flexibility to turn sentiment-based sell-offs into alpha opportunities.
Leveraged Credit Markets Through History
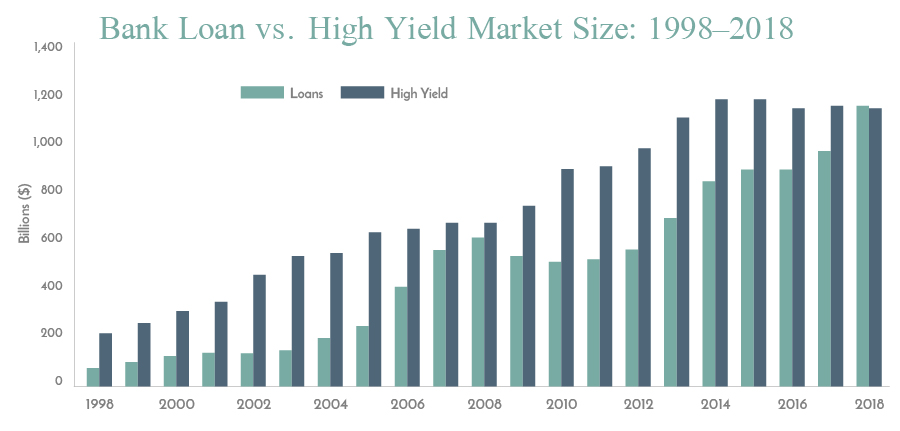
The high yield bond and loan markets have looked similar in industry representation – a lot of automotive, media, and energy companies – but higher-risk issuance of leveraged buyouts (LBOs) historically pushed high yield to a greater market share.
This dynamic started to shift with the ascension of collateralized loan obligations (CLOs), which have become the main buyer of bank loans over the last six years, acting as a catalyst for exponential growth in the loan market. Currently, CLOs hold roughly two-thirds of all loans, with strong fund flows driven by investor demand for interest rate protection pushing the total loans outstanding to $1.46 trillion, according to Dealogic.1
With 2018 issuance tilted to loans, high yield is centered on re-financing, leading to a moderation or slight decline in market size after a trajectory of growth dating back to 1998.

Bank of America Merrill Lynch Global Research, S&P/LCD, ICE Data Indices LLC as of 11/30/18.
This paradigm shift has had a notable impact on the debt ratings of individual loans and bonds. The high yield market’s credit quality has improved with an increase in BB rated debt, while the loan market quality has declined with an increase in B rated debt and a decline in BB rated debt. These differences are just one landmine for managers to navigate in today’s markets.
Not All Loans are Created Equal
There has also been a significant erosion in loan covenants, with JP Morgan estimating that covenant-lite loans now make up 80 percent of issuance. Covenants typically stipulate what rules borrowers must follow to preserve the terms of the loan and forestall the risk of bankruptcy. These provisions can include maintaining interest coverage and leverage ratios and preserving the lender’s position in the capital structure.
Separately, “loan-only” issuance has increased to 70 percent, diminishing the subordination cushion that typically absorbs the impact of loan defaults. Without an additional layer, senior loans are not really senior to much other than equity, potentially lowering recovery rates. And finally, many loans are funding technology and services companies, which lack the hard assets that can preserve the value of lenders in the event of a bankruptcy.
These fundamental risks accompany a major technical risk that we believe is likely to arise if loan downgrades occur when the current credit cycle ends. According to estimates from Moody’s and others, approximately 70 percent of CLO holdings consist of single-B loans. That puts those vehicles on tenuous footing with rating agencies, which usually require CLOs to begin marking loans to market instead of face value when CCC holdings exceed 7.5 percent of total assets. With CLOs already holding an average of four percent of loans rated CCC or lower, a modest swath of downgrades can start an avalanche of price declines. However, it’s important to put this in perspective: in the 2008 financial crisis, CLOs realized a loss rate of just above one percent compared to nearly 40 percent in the broader structured finance market.
Credit quality is a real risk, especially in the wrong hands. Yet, as the economic and credit cycles age, dislocation also presents potentially attractive opportunities for fixed-income funds in the right ones.
What Should Fixed-income Portfolios Look Like?
As with any threat of risk, there may be a natural flight to safety into Treasuries and short-duration bonds. However, that strategy is not without uncertainty, and given the low-yield environment, promises minimal return potential.
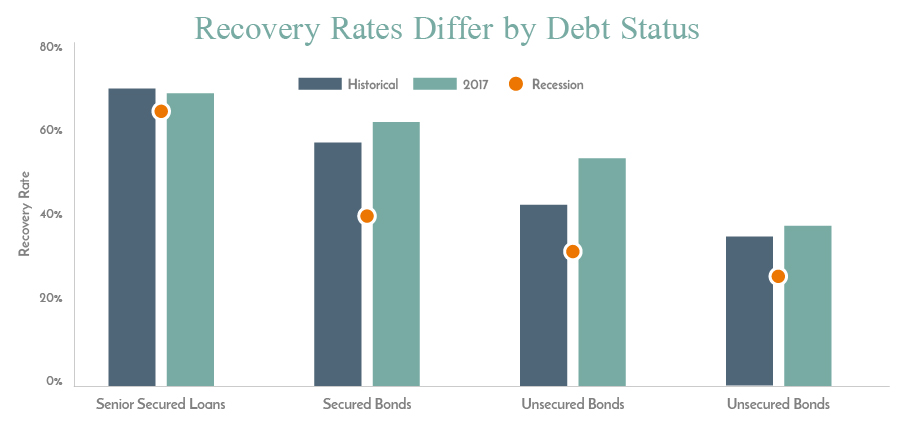
Despite current variance in credit quality, loans’ first-lien, senior-secured status should continue to ensure that recovery rates, on average, are higher than subordinated and unsecured debt. In fact, investors do have history to fall back on. While past performance is not always indicative of future results, senior loans have realized higher recovery rates during previous recessions.

Moody’s, Guggenheim Investments. Based on Moody’s data from 1987-2017. The Recession data reflects the recovery rates in 1990, 1991, 2000, 2001, 2008, and 2009 for each debt type. In the event of liquidation, repayment of loan principal in default is unlikely, regardless of repayment priority.
Active managers who diligently manage credit exposure will focus on monitoring leverage ratios, avoiding loan-only capital structures, and understanding the potential perils of forced selling due to credit downgrades. We believe that mitigating these risks includes a thorough analysis of an issuer’s asset coverage, capital structure, and ability to access capital in the event of a downturn.
It is also paramount to look into fund structures that match the liquidity features of the underlying asset class. Bonds and loans are in the best of times a semi-liquid asset class, and owning them in a traditional mutual fund presents a dangerous liquidity mismatch. These funds offer daily redemptions, but invest in illiquid loans that may be hard to sell into falling markets.
During a late-2018 period of market dislocation, investors hammered loan mutual funds with $18 billion in outflows, nearly an avalanche of 16 percent of assets from the market’s peak at $175 billion in September 2018.2 Daily liquid funds were forced to sell at a loss to meet redemptions, representing a significant loss of investors’ hard-earned dollars.
We believe interval funds may offer a solution to this structural problem. These 40-Act funds are unconstrained by daily redemption requests. They price daily, but offer periodic liquidity, typically quarterly, at between five and 25 percent of shares outstanding.*
Active interval fund managers may have more flexibility to weather and even take advantage of market panics. They can buy and sell based on their expertise, not investor sentiment; selling underlying holdings if they believe the dip may go lower and acting on potentially enticing buying opportunities if fundamentals are in the issuer’s favor.
Today’s credit markets are full of potential pitfalls. Retreating to low-yielding government bonds may not help investors generate the income they need, while loan mutual funds set to a benchmark may not be equipped to navigate this late-cycle environment. We believe actively managed portfolios that match the liquidity of the underlying holdings may help unlock attractive total return potential while helping mitigate both credit and liquidity risks.
For more insights on today’s credit markets, visit www.ResourceAlts.com.
1 MarketWatch. Leveraged Loans are in unchartered territory and that’s a big risk Moody’s says. 1/27/19.
2 CNBC. More cracks are appearing for leveraged loans that helped cause the financial crisis. 1/29/19.
*Interval funds typically allow for limited redemptions on a periodic (typically quarterly) basis. The interval fund’s prospectus will outline that fund’s redemption policy. Regardless of how the fund performs, there is no guarantee that shareholders will be able to sell all of the shares they desire in a quarterly repurchase offer. Due to this redemption feature, interval funds should be considered illiquid investments.
Resource Securities LLC, Member FINRA/SIPC.
The information contained herein is intended to be used for educational purposes only and does not constitute an offer to sell or a solicitation to purchase securities. Such offers or solicitations can only be made by means of a prospectus. Prior to making any investment decision, you should read the applicable prospectus carefully and consider the risks, charges, expenses and other important information described therein. The value of your investments may decline, and you could lose some or all of your investment. The prospectus can be obtained by contacting your financial advisor or by visiting our website at www.ResourceAlts.com.
Resource has two interval funds that are distributed by ALPS Distributors, Inc. (ALPS Distributors, Inc. 1290 Broadway, Suite 1100, Denver, CO 80203). Resource Real Estate, LLC, Resource Alternative Advisor, LLC, their affiliates, and ALPS Distributors, Inc. are not affiliated.


