The Interesting Effects of Changes in Discount Rates and Cap Rate Assumptions on NAVs
May 31, 2022 | James Sprow | Blue Vault
A recent article on the differences in appraised values that a certain ex-president owner of commercial property has reported to his mortgage bankers and county tax authorities sparked this researcher’s interest in the regular NAV calculations by continuously offered nontraded REIT programs. Digging into those NAV calculations and their methodologies makes for some interesting observations. The question this researcher set out to answer was “How much of the appreciation in the Net Asset Values (“NAVs”) of the nontraded REITs that report their NAVs per share monthly can be traced to changes in the discount rate and exit capitalization rate assumptions used by appraisers?” Real estate appraisals typically rest on assumptions about recent transactions in similar assets, replacement costs, and the discounted present values of future cash flows. In this look at how NAV REITs value their portfolios, we will focus on the third method of arriving at valuations: discounting future cash flows to estimate present values.
How Discount Rates and Exit Cap Rates Are Used
Appraisers can use discounted cash flow analysis to value commercial real estate assets. For example, a distribution warehouse that is classified as an “Industrial” asset in a nontraded REIT’s reports can be valued by discounting the future lease payments less landlord expenses to find the “net present value” of the cash flows generated during the years the asset is owned by the REIT. If an assumption is used about the optimal holding period for the property, the terminal value of the asset at the end of the holding period can be calculated using an “exit cap rate.” The term exit cap rate or terminal cap rate refers to the rate used to calculate the resale price of a property by capitalizing its expected Net Operating Income (NOI) at the end of the planned holding period. The estimation of the resale price is necessary when evaluating a particular property for investment purposes.
In the below example, we assume a property is generating $1 million in net cash flow to its owner in Year 1, and this cash flow increases each year via escalation clauses in the lease of 2% annually. We assume that the property is held for seven years and then sold at a price that capitalizes its terminal cash flow that occurs in Year 7 using a cap rate of 4.5%. The importance of the discount rate assumption and the exit cap rate assumption is evident in this simple example. All values are in $ the thousands.
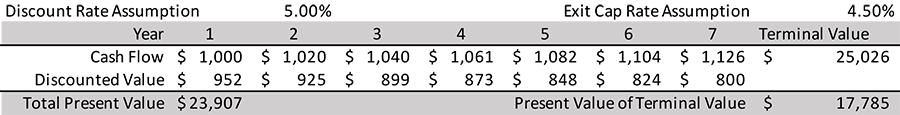
In this simple example, the cash flows over the seven-year holding period are discounted back to the present using the 5.00% discount rate. The Terminal Value is calculated by using the 4.50% cap rate divided into the Year 7 net cash flow to arrive at an exit value (that the property can be sold for after Year 7) of $25.026 million. Discounting that value back to the present at 5% gives a value of $17.785 million. Adding the discounted values of the net cash flows over the seven-year holding period to the discounted value of the terminal value (selling price) gives a total present value of $23.907 million.
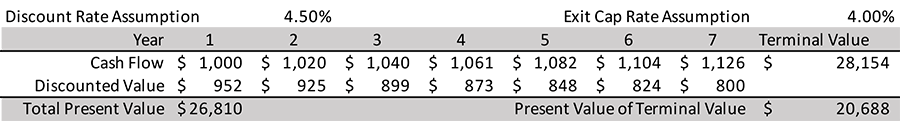
In this example, we can illustrate the impact of using a lower discount rate (say 4.50%) and a lower exit cap rate (say 4.00%) on the present value of the same property with the same assumption about the annual escalation of net cash flows (2%). Using these adjusted rates results in an increased value estimate for the property, rising to $26.810 million, a 12.1% in value for just a 50 basis point adjustment in the discount rate and exit cap rate.
How Does This Apply to NAV REIT Valuations?
We can venture a guess that most shareholders in the common shares of so-called NAV REITs, those nontraded REITs that offer their shares continuously, do not dig very deep into the methodologies that appraisers use to value the REIT’s commercial real estate portfolios. In monthly filings with the SEC labeled 424B3s, the continuously offered REITs report their NAVs and revise their transaction prices for the following month.
Every monthly 424B3 filing gives the components of the REIT’s net asset value, beginning with the valuation of the investments in real estate. Other investment values in the report may include investments in real estate debt, investments in unconsolidated entities, cash and cash equivalents, and other assets. To arrive at the net asset value figure, the total of the REIT’s liability values are subtracted from the asset values. The largest of those liabilities is usually the mortgage debt used to finance property acquisitions. The use of debt to finance property acquisitions is described as leverage, and the greater the use of leverage, the greater the impact that changes in commercial property valuations have on the NAVs per share.
The math is very straightforward. For example, let’s look at a simplified version of the Blackstone REIT “Components of NAV” in their April 30, 2022, 424B3 filing.

The net asset value per share (averaged across the four different share classes and partnership units) is calculated by dividing the total net asset value by the outstanding shares/units. As of April 30, 2022, this was $14.94.
Now, let’s assume that there is a 5% revision upward in the value of the REITs assets. Since over 90% of this REIT’s assets are in real state investments and less than 10% in cash and other assets, this 5% increase in asset values is not an unreasonable rate of appreciation over a few months, especially in today’s real estate market. It is also not unreasonable to assume that the value of the REIT’s liabilities would not increase along with the increase in asset values, especially in an environment of rising interest rates. (The valuation of debt obligations can actually be negatively related to rising interest rates, resulting in a lower valuation and less to be subtracted from the total assets.)
Using the assumptions that asset values increase by 5% and liabilities remain the same, we see the effect of the use of leverage on the net asset values of the REIT. Leverage increases the NAV by 9.0% in this simple scenario.

Next, we look at the estimates contained in the 424B3 concerning the impacts of different assumptions about the discount rates and exit capitalization rates used by the third-party appraisers to value the REIT’s assets. These potential impacts are expressed as changes in the NAVs per share for an incremental change in the discount rates and exit cap rates of 0.25% or 25 basis points. The effects are positive on the NAVs when the discount rates and exit cap rates used in the asset valuations decrease by 0.25% and the effects would lower the NAVs if those rates increase by 0.25%. Over the last two years, we see that the discount rates and exit cap rates have declined for every asset type in the NAV REIT’s portfolio.
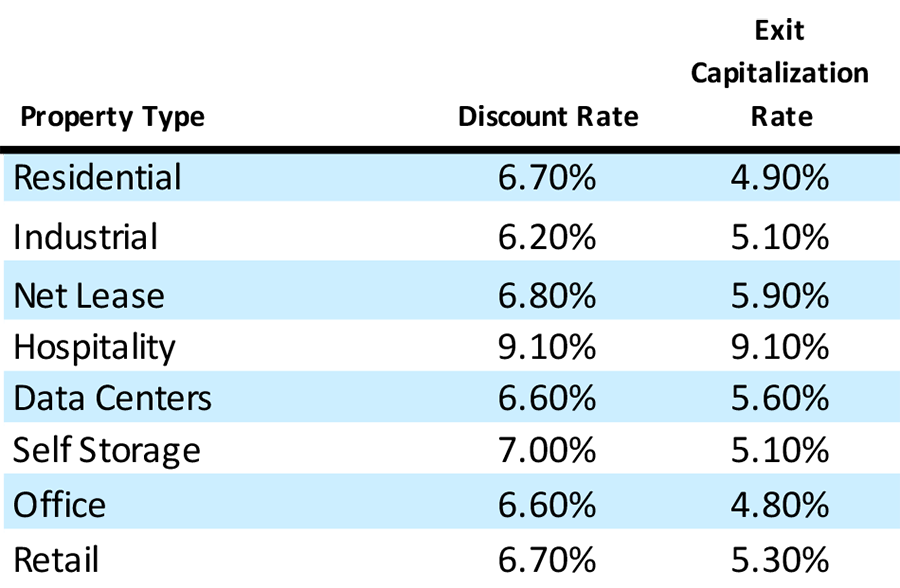
Here below are the tables from the 424B3s for Blackstone REIT from April 30, 2020, and April 30, 2022. Note that for every asset class (with some slight changes in the definition of asset type and additional asset types), the discount rates and exit cap rates have declined over that period.
Discount Rates and Exit Capitalization Rates for Blackstone REIT’s NAV Calculations
April 30, 2020
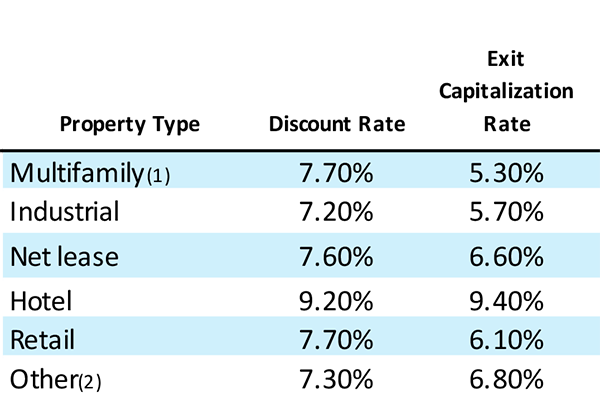
April 30, 2022
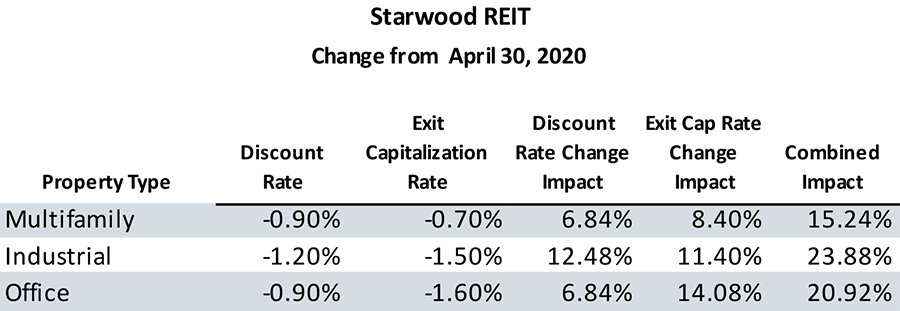
We can look at the changes in rates over the last two years for both Blackstone REIT and Starwood REIT, the two NAV REIT programs that have raised the greatest amounts of capital over that period (roughly 75% of all capital raised by NAV REITs since April 30, 2020). In every asset class over the two years, the rates used in valuing the cash flows from the two REITs have declined, meaning that the asset values have increased, holding all other factors constant.
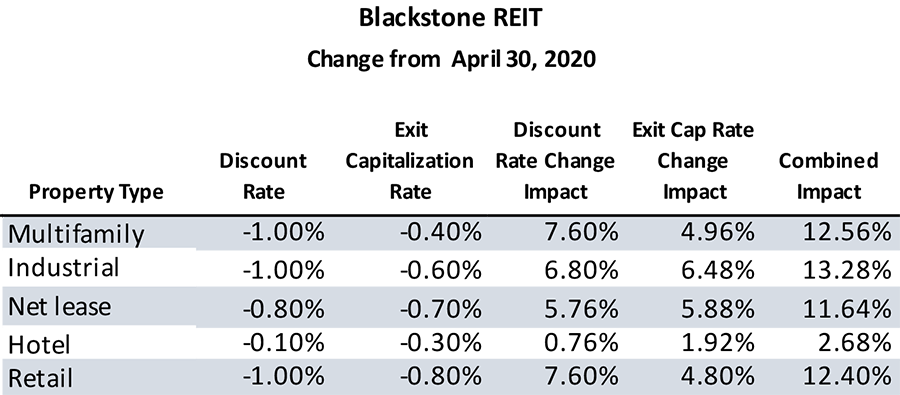
When we calculate the combined impact of the rate changes, using the estimates in the 424B3s reported by the REITs, we see significant increases in net asset values that can be explained by the decreases in the discount rates and exit cap rates assumptions. For example, Blackstone REIT has the largest portion of its property portfolios in both April 2020 and April 2022 in the industrial asset type. Using the estimates provided in the 424B3 for the sensitivity of the asset values to differing assumptions about discount rates and exit cap rates, we can calculate that, holding other assumptions constant, the value of the REIT’s industrial asset investments could have increased by over 13% over the two years simply due to the changes in the discount rate and exit cap rate. The significance of that increase can be seen when we compare the REIT’s NAV per share as of April 30, 2020, ($10.4493 per Class I share) to the most recent estimated NAV per share as of April 30, 2022 ($14.9680 per Class I share). The appreciation in the NAV was 43%, a very significant appreciation in shareholder values. We can say that at least a portion of the increase, roughly one-fourth, could be explained by the decrease in discount rates and cap rates used by appraisers in arriving at their estimates of the NAVs.
For Starwood REIT, which had its NAVs per share appreciate from $21.22 per Class I share as of April 30, 2020, to $27.34 as of April 30, 2022, the impact of changes in discount rates and exit cap rates on NAV estimates could be more significant. With 65% of its property portfolio invested in multifamily assets as of March 31, 2022, the 15.24% combined impact of changes in the discount rates and exit cap rates could explain a significant portion (over half) of the 29% appreciation of the REIT’s assets. The industrial and office assets would have had an even greater impact on their values.
Conclusion and Future Implications
This exploration of the potential impacts of changing assumptions used in NAV calculations is not meant to be definitive or exact. We simply must consider that these assumptions can have significant impacts on the NAVs of these REITs. We must also consider that a portion of the positive impacts that we have observed over the last two years are due to changing assumptions. That leads to the question about the direction of NAV changes going forward. As interest rates rise we will probably see increases in discount rates and exit cap rates used in NAV calculations. The effects of increases in these rates will most likely be just the opposite in direction compared to what we’ve seen since April 2020. Cap rates for commercial real estate asset types are currently at lows unseen for a long time. As they rise within the general interest rate environment, the effects on NAVs can be significant, and less favorable than what we’ve observed in recent years.
Of course, there are strategic choices that the NAV REITs can make to lessen the impact of rising discount rates and exit cap rates. For example, the escalation clauses in lease contracts can be set to higher annual rates. The NOI (net operating income) and net cash flows from the REIT’s portfolio can be improved through effective management. The rates on the REIT’s debt can be managed and have been managed by fixing them or hedging them with interest rate caps. Many management strategies can successfully increase the value of commercial real estate portfolios, not the least of which are the choices of asset types. Blackstone REIT and Starwood REIT have seen large increases in NAVs over the last two years because they’ve chosen industrial and multifamily assets as a significant focus of their acquisitions and avoided office and hospitality assets that have yet to recover from the impacts of the pandemic. A question that remains is whether those asset types will outperform in the next few years as well. Large portfolios of commercial real estate, like large ships, cannot be easily turned when conditions change.
Sources: SEC, Blue Vault, REIT Websites