When recommending and choosing nontraded REITs for their clients, most advisors know the importance of looking at key metrics such as debt, distribution yield, MFFO payout ratios, and portfolio diversification. However, these metrics may vary greatly from REIT to REIT, depending on where each program is in its life cycle.
Blue Vault has created a classification system that for the first time allows advisors to effectively compare nontraded REITs. Using this system, advisors can see how a REIT stacks up to its peer group, as well as avoid meaningless comparisons between REITs that are in different life cycle stages. As an example, there’s an inherent inconsistency in comparing newly created REITs with REITs that are five years or older.
Nontraded REITs’ Unique Nature
As discussed in a previous issue of Insights from Inside the Vault, nontraded REITs are very different from publicly traded REITs and tend to mirror the performance characteristics of direct property investments, private equity, and other illiquid vehicles. Such investments move through distinct developmental stages over time as they grow from inception to maturity.
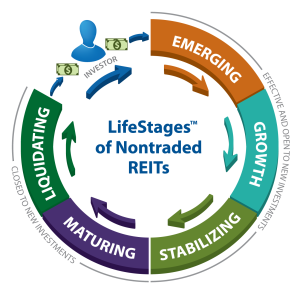
Nontraded REITs’ unique life-cycle includes raising capital, acquiring assets, and paying distributions to investors. Their ultimate goal is to create a liquidity event for investors to return their capital and, ideally, some appreciation. During a nontraded REIT’s “open” phase, it’s actively raising capital. During its “closed” phase, it no longer accepts new investments.
The LifeStages™ “Bands”
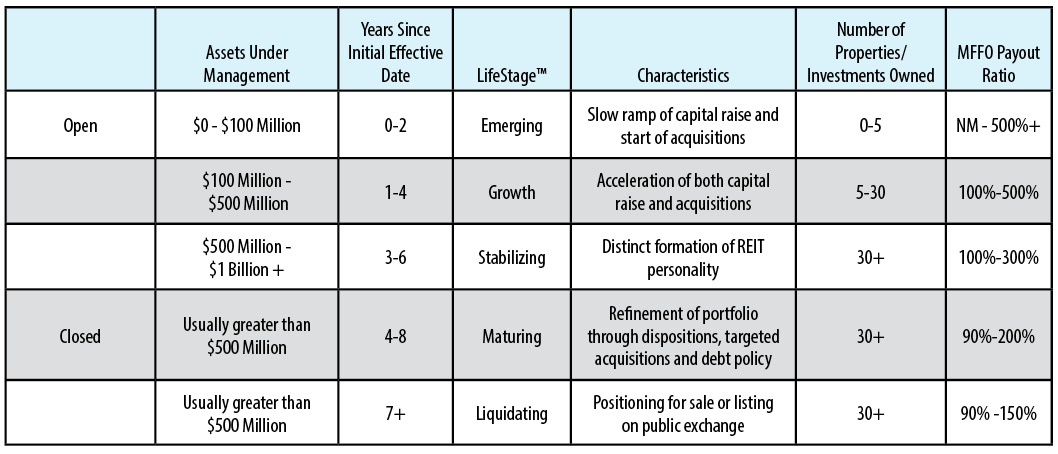
From these two basic categories, Blue Vault has further delineated five sub-segments to allow more effective peer-to-peer comparisons. Each sub-segment — or “band” — is marked by certain capital raise and acquisition characteristics, as well as a specific debt profile.
Emerging
In the emerging phase, REITs are typically less than two years old. They generally have less than $100 million in assets and usually will own no properties upon commencing fundraising — also known as a “blind pool” offering. While this term may seem scary, it’s highly unusual for a new REIT at this stage to already own properties. However, as fundraising ramps up, you can expect acquisitions to soon follow. Emerging nontraded REITs are intensely focused on raising capital.
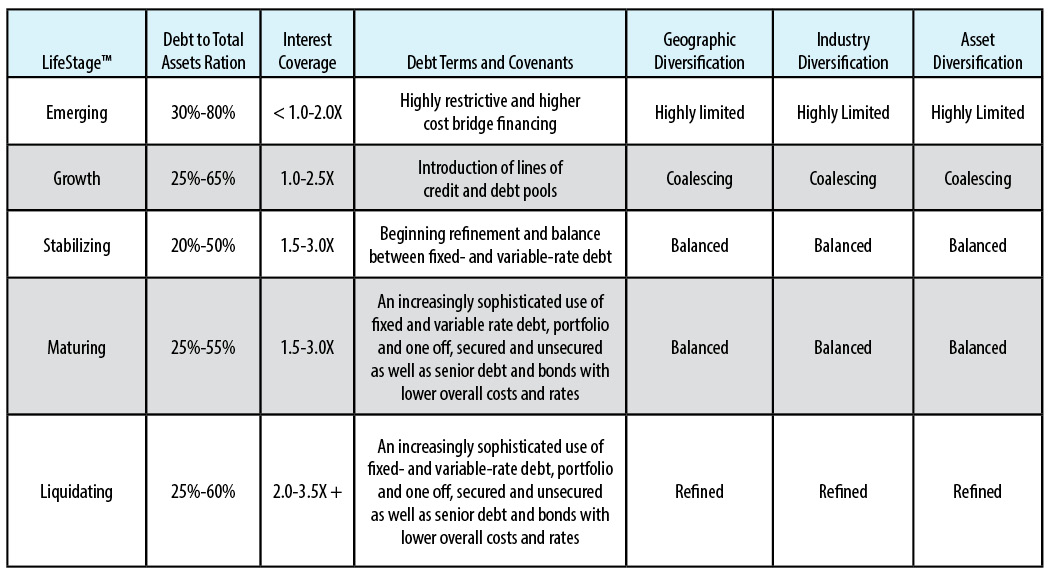
Emerging REITs will likely seem risky on paper. For example, distribution rates will almost always exceed cash flow from operations and FFO early on; therefore, don’t be surprised to see distribution deficits. If the REIT is paying a distribution — and many don’t initially — you can expect the MFFO payout ratio to be 500% or more. Debt will be at its highest during this phase — perhaps as much as 80% of the REIT’s total assets — and come in the form of highly restrictive and higher cost bridge financing. Diversification in the portfolio is highly limited.
Growth
Nontraded REITs in the growth phase are accelerating their capital raising efforts and acquisition rate. They are typically one to four years-old and have $100 million to $500 million in assets under management. They may own as few as five or as many as 30 properties at this point. The distribution coverage rate could still be as high as 500%, but ideally would be lower and closer to the ideal of 100%.
You will be able to recognize good operators by their capacity to overcome the dividend deficit as quickly as possible. Debt levels should be trending closer to a maximum of 65%, and debt instruments at this phase may now include lines of credit and debt pools. Diversification will coalesce as the REIT acquires assets.
Stabilizing
In the stabilizing mode, the REIT is forming its distinct personality. A stabilized REIT is now three to six years-old, likely owns more than 30 properties, and has $500 million to $1 billion in assets under management. At this point, the distribution coverage ratio should be a lot closer to 100%, but still could be as high as 300%.
Debt levels at this stage could range from 20% to 50% and start to include a more refined mix of fixed- and variable-rate debt. The REIT will begin to maintain balanced diversification across geographic location, industry, and assets. This balance should persist and become further refined for the remainder of the REIT’s life cycle.
Maturing
A maturing nontraded REIT’s acquisition and debt strategy is crucial. By this time, the REIT owns at least 30 properties, has been in existence for four to eight years, and has more than $500 million in assets under management. The REIT will start tweaking the composition of the portfolio by selling certain properties (dispositions) and targeting acquisitions that will enhance the portfolio.
Distribution coverage is generally 90% to 200% — much more palatable than in the earlier phases. Debt levels are a manageable 25% to 55%. Debt costs should be lower at this point, and the REIT will use a sophisticated blend of fixed and variable rate debt, secured and unsecured instruments, and senior debt and bonds. This debt structure should carry the REIT through the remainder of its life-cycle.
Liquidating
A REIT that is ready to liquidate typically displays the same characteristics as a maturing REIT. The REIT is usually seven years or older at this point and plans to position itself for sale or listing on a public exchange.
Debt levels should still be manageable in the 25% to 60% range, and distribution coverage now a healthy 90% to 150%.
The Benefits of Understanding LifeStages™
The LifeStages™ tool creates terms and definitions that make comparing and choosing nontraded REITs easier and more equitable.
The LifeStages™ classification and ranking system places nontraded REITs in peer groups at similar points in their development for comparison and analysis. LifeStages™ metric bands are based upon actual results and historical data. You should see the metrics migrate upward to better levels of operations as a REIT matures. Underperforming REITs may fall out of the normal growth cycle due to poor capital raising or operational execution. Advisors may take this as a cue that a particular REIT is not keeping pace with its peers, which may influence the decision to invest.
As a thought leader in the nontraded REIT industry, Blue Vault believes that this new methodology will help advisors draw more meaningful comparisons and, therefore, make more informed decisions. Each of the LifeStages™ is further explained in the tables below.