James Sprow | Blue Vault
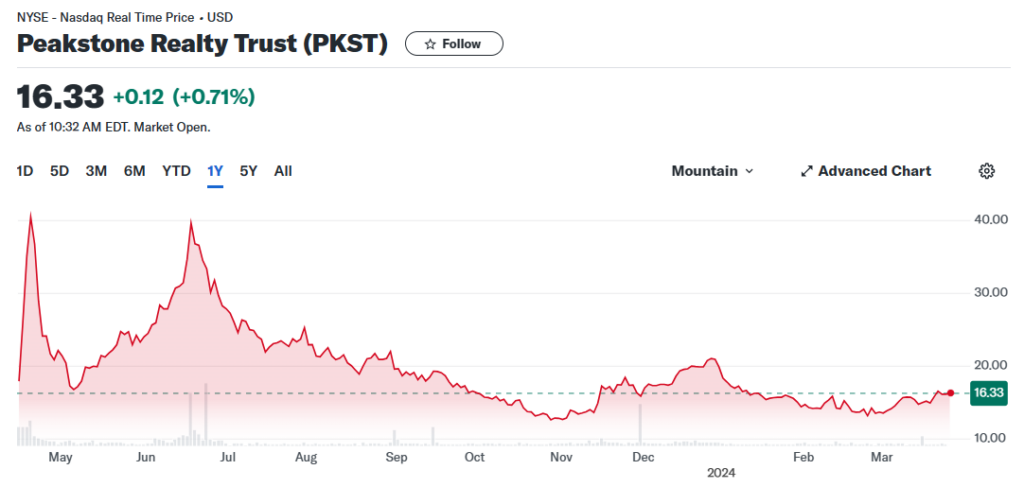
In an article about Peakstone Realty Trust’s roller coaster ride on the NYSE after its listing on April 13, 2023, we tried to dig into the REIT’s financials to understand how its investors could rationally purchase its shares at $42 per share on April 19, watch the share price fall too $16.00 by May 4, then watch the shares rebound to $21.75 by May 16. Well, that wasn’t the end of the ride! In fact, one month later, on June 16, 2023, the shares traded as high as $39.91 before closing at $39.65! Think that was the end of the story? No, from that high in June, the shares have subsequently fallen to $13.27 as of the market close on February 26, and rebound to $16.33 as of March 26. Like one of those rides at Disney World that makes you queasy with the sudden drop, investors who’ve hung on for the ride with PKST must be feeling sick to their stomachs and wondering, how, in a seemingly rational world, this could possibly happen.
By way of background, REITs that hold diversified assets in the U.S. CRE market have been selling at steep discounts to NAV (Net Asset Value per share). In a December Data Dispatch from S&P Capital IQ, it was reported that publicly listed US equity REITs traded at a median discount to their consensus NAVs per share of 10.7%. Notably, those 15 listed REITs that focus on diversified properties traded at a median discount to NAV of 27.1% as of February 29, 2024, the largest discount of all sectors. This can explain some of the steep drop in the per share price of PKST, but it can comprise only a partial explanation.
In the Q4 2023 10-K filing by Peakstone Realty Trust, the REIT reported a real estate portfolio of 71 properties in 24 states, consisting substantially of industrial and office properties with a combined acquisition value of approximately $3.0 billion. During 2023, the REIT sold properties for a total of $335.9 million, for a book gain of $29.2 million. During the first half of 2023, the REIT also recorded a real estate impairment provision of approximately $397.4 million on sixteen properties, including eight office properties. The fair value measurement of the impairment used discount rates for the property cash flows in the range of 8.00% to 15.00%, and terminal capitalization rates ranging from 6.50% to 10.50%. These are historically high discount rates, no doubt related to both the risk inherent in the cash flows to these assets, but also linked to the interest rate hikes we’ve seen in the broader economy.
The Company reports the results of its wholly owned portfolio in three segments which had the following characteristics as of December 31, 2023:
—Industrial: This segment comprised 19 industrial properties and was 100% leased with a WALT of approximately 6.7 years.
—Office: This segment comprised 35 office properties and was 98.8% leased with a WALT of approximately 7.6 years.
—Other: This segment comprised 17 properties and (ii) was 82.4% leased with a WALT of approximately 2.6 years.
As of June 30, 2022, Griffin Realty Trust, the former name of Peakstone Realty Trust, owned a portfolio of 121 properties, which was approximately 93% leased and 92.7% occupied with a weighted average remaining lease term of 6.1 years. Approximately 66.2% of the REIT’s annualized base rents were expected to be generated by properties leased and guaranteed by companies with investment grade credit ratings.
Fast-forward 18 months and PKST’s wholly owned portfolio consisted of just 71 properties. The REIT was pursuing a strategy to shed assets, reduce leverage and re-focus on industrial assets. The portfolio was 96.4% leased. The weighted average lease term was approximately 6.5 years. On a same-store basis, 2023 YOY NOI is 1% higher for the REIT’s industrial properties, 5% lower for its office properties and 3% lower for the “Other” segment. Office properties made up 58% of the NOI on a same store basis, while industrial properties provided 26%. Overall, same store rental income for the REIT’s portfolio was down just 3% YOY.
Michael Escalante, CEO, stated in the Company’s shareholder report: “In 2023, we demonstrated our ability to execute on our objectives to reduce leverage and evolve our portfolio towards the Industrial segment Against the challenges of the current economic environment, we successfully sold 11 assets, enabling a significant leverage reduction, and we achieved strong, positive leasing activity for our portfolio. We ended the year with ample liquidity, a debt stack that is nearly 90% fixed at favorable rates, no material debt maturities expected until late 2025, and minimal near-term rollover in our Office and Industrial segments — all of which provide a stable base to support the execution of our go-forward strategy.”
As of August 10, 2023, S&P Capital IQ estimated PKST’s NAV per share at $30.13, up from its prior estimate by Truist Securities analyst at $28.46, using a cap rate of 8.20%, down from 8.40%. As of February 24, 2024, analysts reporting to S&P Global estimated the REIT’s NAV per share at $27.56. With the PKST common shares trading on that date at $13.77, this was a 50% discount to the NAV estimate. If we apply the 27.1% median discount to NAV for listed 15 diversified REITs as estimated by S&P Global, the $27.56 NAV could be estimated at a $20.09 share price, significantly higher than its recent closing price.
As of December 31, 2023, the REIT’s 19 industrial properties were 100% occupied. Its 35 office properties were 98.8% leased. Its 19 mixed use properties were 82.4% occupied, up from 75.6% in an earlier quarter. The office properties in the REIT’s portfolio have maintained occupancies within the range of 88.3% to 98.8% over the past eight quarters, rising from 88.3% in Q2 2022 to the current rate of 98.8%.
The fundamental metrics of this listed REIT appear to be improving. Re-positioning itself as more of an industrial REIT over time appears to be a logical strategy. Looking at its office tenant mix, occupancies, and the locations of its office properties (mostly in relatively smaller population centers rather than in the depressed office environments of central business districts in major cities) it is hard to understand why the median discounts to NAVs for listed REITs should be applied to this company’s portfolio. Let alone, why the current discount to NAV we observe should be higher than the medians for listed REITs in the office, industrial and diversified categories.
An investment advisor asked me last year, “Is PKST a sell?” Digging into the REIT’s recent valuation and comparing its portfolio’s composition and recent metrics, I honestly wonder why its stock is relatively low. Since its listing last spring, the volatility and pricing of this previously nontraded REIT has continued to cause me to scratch my head. There are legitimate reasons to discount the value of office and industrial properties in today’s economic environment, but that isn’t the whole story for this REIT. PKST’s management appears to be taking steps to improve its prospects. We’ll see if investors agree.
Sources: Peakstone Realty Trust; S&P Global Market Intelligence; Yahoo Finance; SEC