• The weighted average interest rate on debt is simply the stated rate on loans and mortgages outstanding (including the then-applicable variable rate) weighted by the outstanding balances.
• This is not the only direct cost of using debt.
• Financing costs can include points paid to the lender, lender’s attorney fees, borrower’s attorney fees, and other direct costs of issuing the debt.
• Under GAAP, costs of financing are capitalized and amortized over the maturity of the loan.
• The REIT’s cash flows are impacted when the loans are obtained.
• Adding the quarterly amortized financing costs to the weighted average interest rates gives a truer picture of the cost of debt financing
The use of leverage increases both the expected rates of return to a REIT’s shareholders and the financial risk associated with debt. Interest expense is a fixed expense when borrowing rates are fixed, either through the debt terms themselves or through hedging contracts such as interest rate swaps or caps. Variable rate debt adds another level of risk to the REIT’s financing, as rates on borrowing can increase when key index rates such as LIBOR increase and borrowing rates are tied to the index plus a stated margin.
Blue Vault reports the REIT’s debt ratio as the book value of its debt as a percentage of total assets, as well as the breakdown of debt between fixed-rate debt and unhedged variable-rate debt. Variable rate debt can be converted to fixed rate debt through the use of swap contracts, exchanging the uncertain interest expense for a fixed rate with a counterparty such as a bank. Interest rate caps may also reduce interest rate risk, but unless they are binding, meaning the variable rate has reached the cap and can go no higher, they do not fully hedge interest rate risk. Blue Vault treats variable rate debt that has caps in place as variable rate debt unless the caps have been reached.
In this article, we analyze the added cost of borrowing that is represented by financing costs other than interest rates. Those additional costs can include points paid to the lender, lender’s attorney fees, borrower attorney fees, and other direct costs of issuing the debt. For example, if a REIT borrows $100 million either in a mortgage or a line of credit, the lender may deduct financing fees from the principal amount, meaning the net amount advanced to the REIT is less than $100 million. Under GAAP, these financing costs are treated as an asset and amortized over the maturity of the borrowings, even though the cash flows associated with the fees occur at the time of financing.
Related: The Latest Full-Cycle Events for Nontraded REITs
For example, Strategic Realty Trust, Inc. is a nontraded REIT that had $34.5 million in notes payable as of December 31, 2018. It also showed deferred financing costs on its balance sheet as an asset with a net value of $0.74 million. This asset would be amortized (converted to an expense) each quarter over the maturity of the REIT’s notes payable. In 2018 the amortized deferred financing costs were $0.60 million. The REIT’s outstanding debt had a weighted average interest rate of 4.79% (the stated rates of each debt obligation times each outstanding principal balance divided by the total of all debt obligations). Adding to that average interest rate the amortized deferred financing charges results in a more accurate cost of borrowing. In this example, $0.600 million / $34.536 million = 1.74%, resulting in a total cost of borrowing for 2018 of approximately 6.53%.
This more accurate portrayal of the REIT’s cost of using debt financing is important in assessing the REIT’s financial performance as well as the risk of using leverage. The median return on assets (“ROA”) for all nontraded REIT’s in Blue Vault’s coverage for the trailing 12 months was 6.18%. This ROA is simply the net operating income (“NOI”) divided by the average assets over the period. If the REIT used no debt and financed all of its assets with equity, the return on equity (“ROE” and the return to shareholders for the period) would be the same as the ROA. With the use of leverage, the return on equity can be greater whenever ROA exceeds the cost of debt financing, and the degree to which the ROE increases is related to the REIT’s ratio of total debt financing to total equity financing.
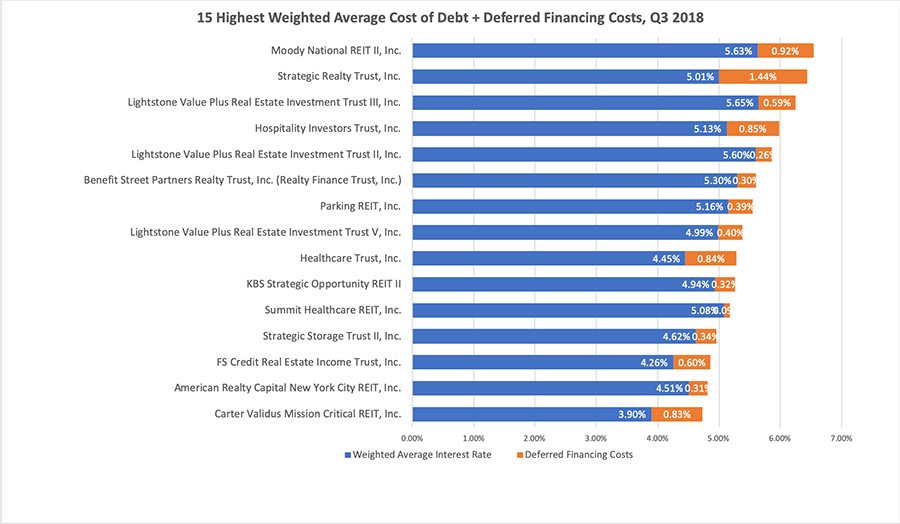
For some nontraded REITs that utilize debt financing, the deferred financing costs that are amortized each quarter do not amount to a significant increase in the average cost of borrowing. For others, the added cost is very significant, as the Strategic Realty Trust example illustrates. In the chart below, we illustrate how significant these additional costs are for the 15 nontraded REITs with the highest average total costs of borrowing, as of Q3 2018.
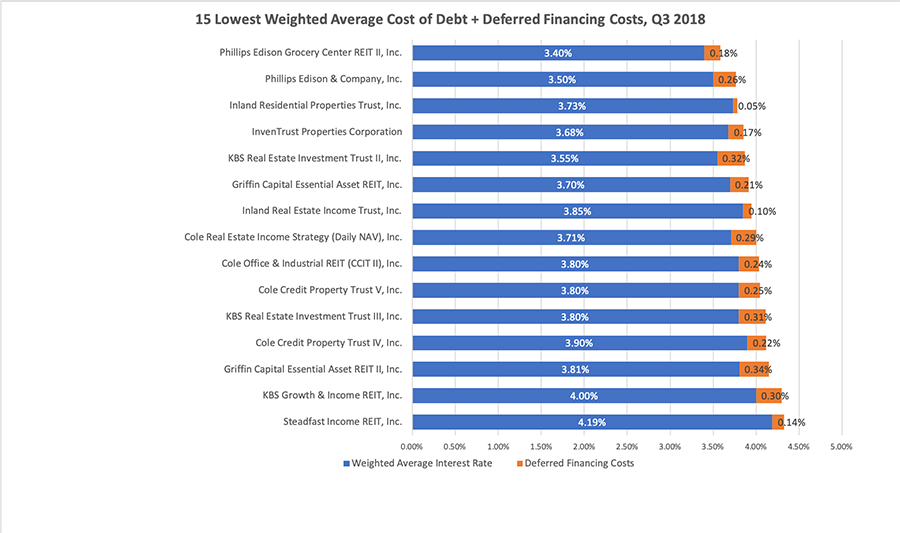
Below we illustrate the nontraded REITs for which the additional cost of borrowing together with their weighted average interest rate on debt is the lowest among all nontraded REITs.
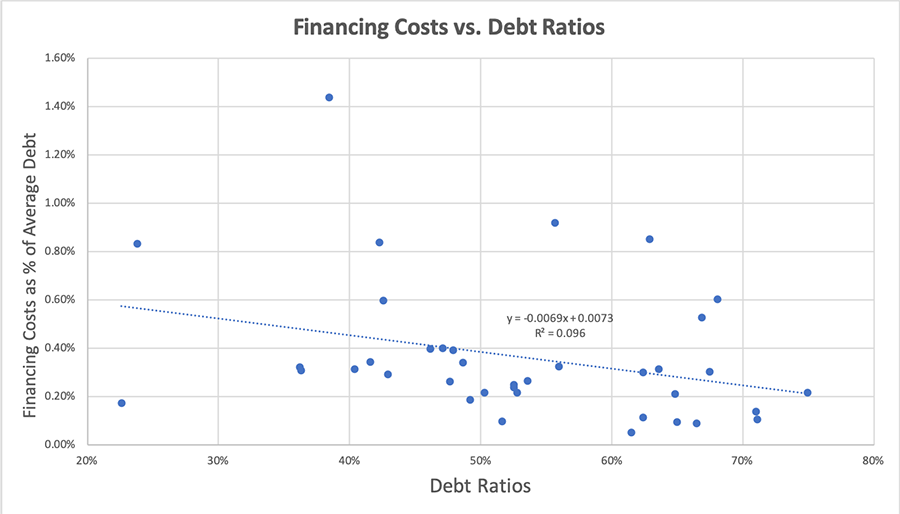
There does appear to be a weak relationship between the financing costs that are being amortized over the maturities of the related debt. Higher debt ratios are related to lower amortized financing costs, suggesting there are economies of scale in using debt to finance commercial real estate portfolios. However, statistically, the relationship is not strong.
In conclusion, nontraded REITs have costs of borrowing that are not completely reflected in the weighted average of the interest rates on the individual debt contracts. To more accurately measure the cost of borrowing, we must add the deferred financing costs. The cash flows related to these costs occur at the time the debt is obtained, not over the life of the debt, meaning that amortizing the costs over the maturity of the loans as GAAP proscribes tends to understate their impact.
Sources: SEC, Blue Vault Partners