In the recent study prepared in collaboration with The University of Texas called, “Nontraded REIT Industry Full-Cycle Performance Study,” in addition to analyzing the total returns of the 17 nontraded REITs that went full-cycle between 1990 and March 2012, the findings also provided insights into what we might call “Timing versus Selection.”
Timing decisions made by management include when to raise capital, when to invest in commercial real estate, and eventually, when to take the nontraded REIT full-cycle. Selection decisions made by management primarily concern the selection of investment properties for the REIT’s portfolio. We could say that over time a REIT’s performance depends on both when it buys and sells and what it buys and sells. Looking at actual nontraded REIT performance, can we determine the relative importance of these two types of decisions?
Market Timing
With exchange-traded assets, shareholders make their own timing decisions regarding when to buy and sell. Shareholders in nontraded REITs depend upon the timing decisions of the REIT’s managers to give them a portion of their total return.
Great timing in any market involves buying low and selling high, and while we cannot expect REIT managers to time markets perfectly, we can measure their relative success by comparing the REIT’s returns over its life to the average returns of a commercial real estate index over a longer period of time. A REIT that invests when market prices are relatively low and achieves a full-cycle liquidation for investors when market prices are relatively high may owe much of its performance to fortunate timing. By contrast, another REIT may have invested in a relatively more expensive environment and liquidated in a less attractive market, and the lower returns it provides investors may be largely attributable to less fortunate timing.
For example, looking at the FTSE NAREIT All Equity REITs return index data since 1990, we find that there are 56 unique 8.5-year holding periods. An average equity REIT that had timed its investments perfectly could have experienced an annualized return of 17.6% by matching the best 8.5-year holding period for the FTSE NAREIT All Equity Index (2Q 1999 through 3Q 2007). An average equity REIT that had the misfortune of fully investing in 4Q 2000 and liquidating in 1Q 2009 would have experienced an annualized return of only 2.2%. Thus, timing alone could explain a 15.4% difference in the average annualized returns of the two REIT portfolios over equal holding periods. Of course, for shorter actual holding periods, one could observe even more extreme differences in average returns.
Portfolio Selection
Since it is nearly impossible to perfectly time a bull market, a significant amount of expertise is needed in order to identify, purchase, and manage commercial properties in order to realize a capital gain. By isolating the portion of a REIT’s annualized return that is unrelated to market timing, we can assume that the REIT’s annualized rate of return minus the return on a representative index captures the “value added” above (or below) the average return for a similar portfolio over the same holding period. In very simple terms, this is the difference in returns attributable to property selection and management within the portfolio.
This is exactly what the Blue Vault/University of Texas Full-Cycle Study did by constructing benchmarks that compared returns for each of the 17 nontraded REITs with a custom index that was created by matching proportions of property types and regional distributions of properties to the nontraded REIT’s actual portfolio. As a result of our analysis, we found this value added for the 17 nontraded REITs in the study ranged from +17.36% to -9.57% annualized versus publicly traded REIT returns.
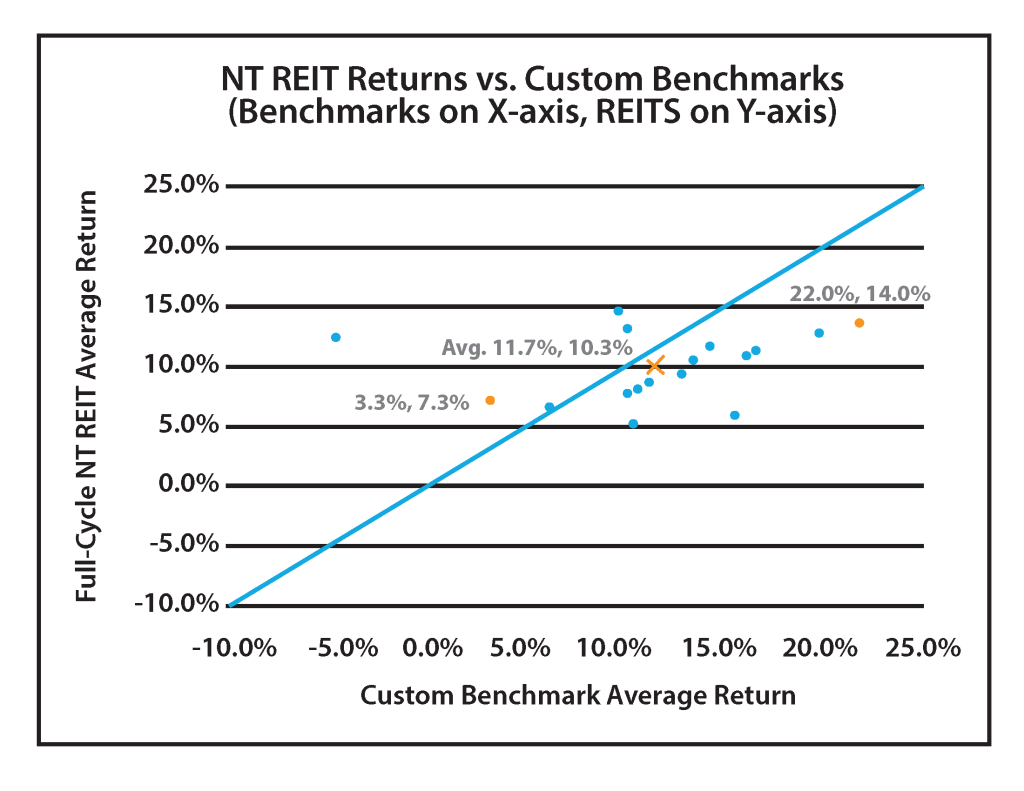
The chart below plots the actual nontraded REIT returns versus the custom benchmark returns. The 45° line represents a perfect match between a nontraded REIT’s return and a custom benchmark return for the same holding period. A well-managed REIT outperformed its benchmark portfolio even though its annualized return of 7.3% is below the average return (point “×”) of 10.3% for the 17 nontraded REITs in the study. Likewise, a relatively high annualized REIT return of 14.0% does not compare favorably to its annualized benchmark return of 22.0% for the same holding period.
One important observation: the variation in custom benchmark returns was greater (-4.7% to +22.0%) than the variation in the 17 full-cycle nontraded REIT returns (5.3% to 15.1%). While the full-cycle nontraded REITs may have underperformed their custom benchmarks, they also appear to have delivered a significantly lower level of market risk in their sectors.
Conclusion
A nontraded REIT can produce full-cycle returns for investors through timing its initial investments and its full-cycle event, and through the selection and management of the property portfolio. The full range of actual full-cycle returns can be explained when we look at how much of the REIT’s return was due to timing and what portion of the return remains after adjusting for the return on a custom benchmark of similar property types and locations. While all of the full-cycle nontraded REITs in the Blue Vault/University of Texas Full-Cycle study provided shareholders with positive returns averaging 10.3%, five of 17 outperformed their custom publicly traded REIT benchmarks through superior selection and portfolio management.
If you have not obtained a copy of the complete results from the Nontraded REIT Industry Full-Cycle Performance Study and are interested in learning more about the five nontraded REITs mentioned above, please contact us at 877-256-2304for more information.
Download PDF of this article here.