Update on the Performance of Continuously Offered Nontraded REITs
May 6, 2021 | James Sprow | Blue Vault
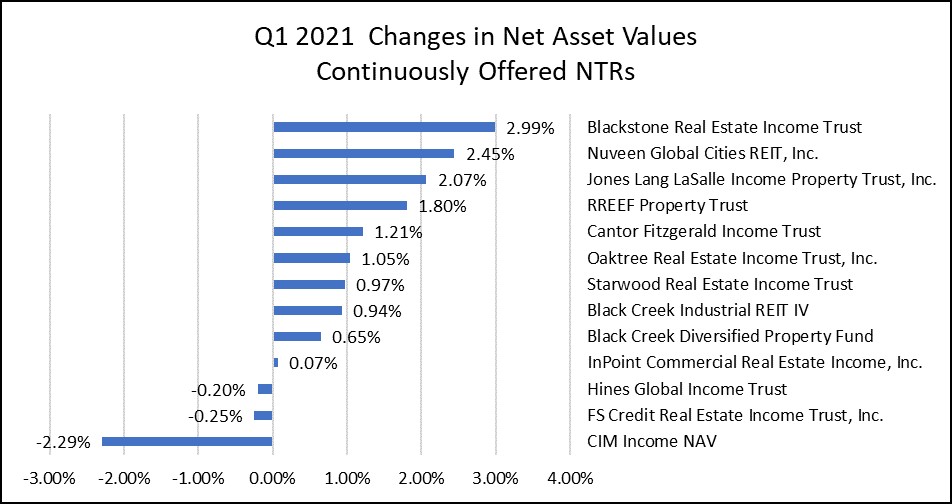
 The changes in net asset values per share (NAVs) for the continuously offered nontraded REITs were very encouraging as the commercial real estate market strengthened in the first quarter of 2021. Table I shows the 3-month change in NAVs. All but three NTR reported higher estimated NAVs as of March 31, 2021. All changes are calculated for Class I shares except for Jones Lang LaSalle (Class A) and Cantor Fitzgerald Income Fund (Class IX). Chart I shows how the changes in Q1 2021 NAVs rank. Blackstone REIT led the sector with an increase of 2.99% in per share NAV for Class I shares.
Table I
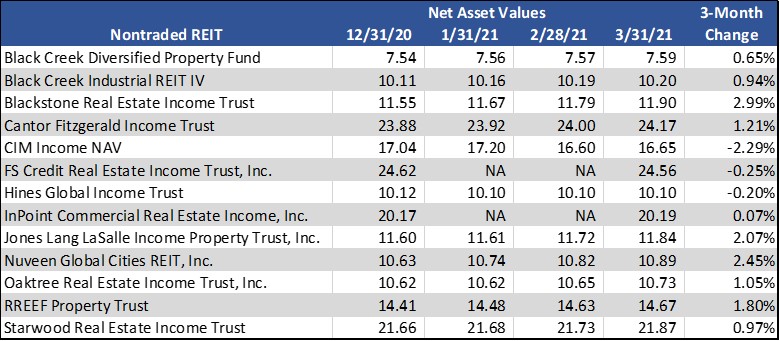
Chart I
When distributions are included, total returns to the shareholders in continuously offered REITs for the first quarter of 2021 improve considerably. With distributions, all but one continuously offered NTR showed positive returns in Chart II.
Chart II
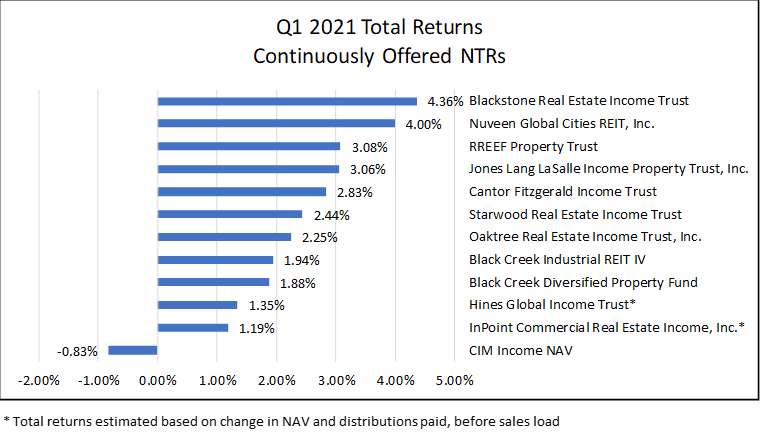
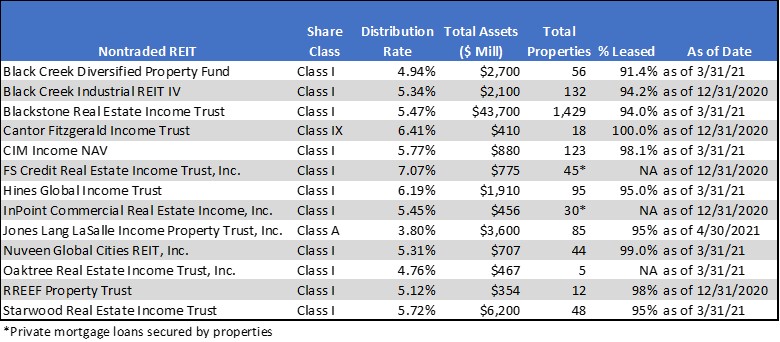
Table II shows a selection of metrics for the 13 continuously offered REITs. Taken all together, those REITs were likely managing over $64 billion in assets as of March 31, 2021, which would comprise roughly 57% of the total assets of all nontraded REITs.
Table II
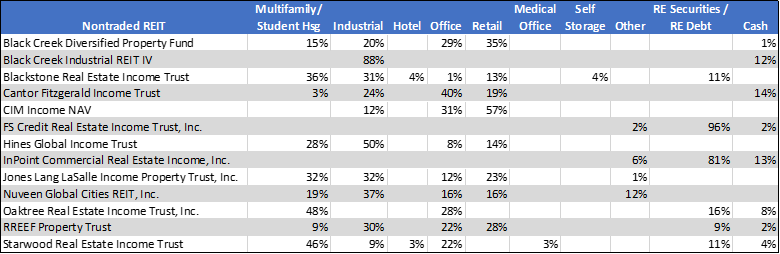
The variation in total returns and changes in NAVs for the 13 REITs can be partially explained by the relative concentrations of their property portfolios in different asset types. For the year-to-date as of May 5, total returns by asset type among listed REITs have been strong for apartment REITs at 18.9%, compared to industrial REITs (+12.9%), free-standing retail (+9.9%) and office REITs (+9.2%). The relative portfolio concentrations for the NTRs with continuous offerings are estimated in Table III as of December 31, 2020.
Table III
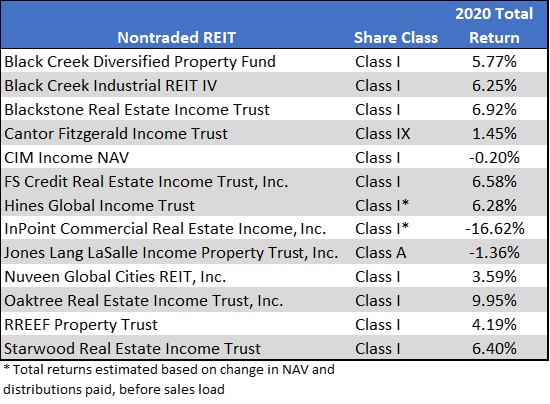
Looking back at 2020, the total returns for the 13 NTRs varied from a high of 9.95% for Oaktree Real Estate Income Trust to a low of negative 16.62% for InPoint Commercial Real Estate Income. According to NAREIT, the index for 13 listed commercial financing REITs in 2020 showed a total return of negative 10.7% which can partially explain the poor performance of InPoint Commercial Real Estate which is a mortgage financing NTR. (see Table IV)
Table IV
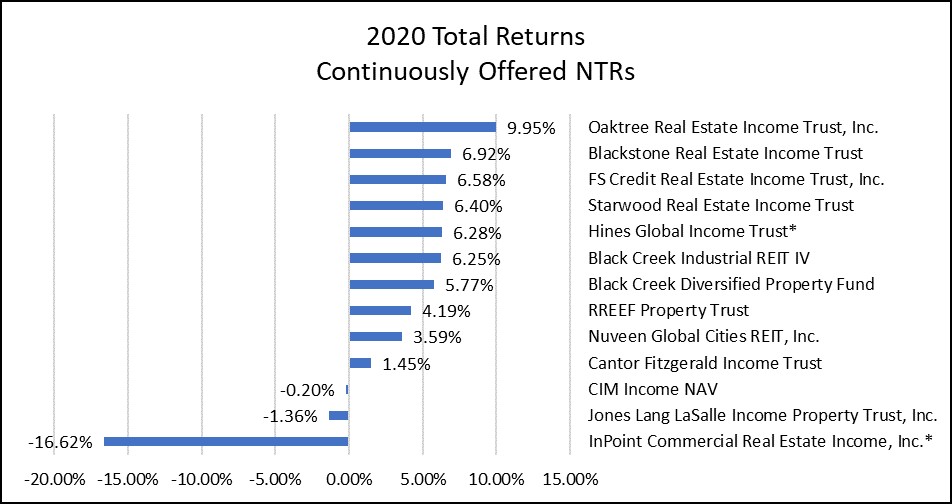
The total returns in 2020 for the 13 continuously offered NTRs are shown in rank order in Chart III.
Chart III
An important factor in evaluating the performance of nontraded REITs vs. listed REITs is the low standard deviations of the nontraded REIT monthly returns when compared to the volatility of listed REIT returns. The standard deviation of the average monthly returns among the 13 REITs in this article was just 0.6%% between January 2020 through March 2021, meaning roughly 2/3 of the monthly variation in total returns fell within a range of +0.9% and minus 0.3%, much lower than the variation among the returns to listed All Equity REITs that had a standard deviation of monthly returns of 6.6% over the same 15-month period. In fact, in March 2020, when the COVID-19 pandemic hit the U.S., the index of All Equity REITs had an average return of negative 18.7% while the NTRs had an average return of negative 1.4%. Along with the lower variation in monthly returns, nontraded REIT returns also have a low correlation with the returns in the broader market, making them an attractive investment to reduce portfolio risk.
In conclusion, the continuously offered nontraded REITs have performed well, both in 2020 and in the first quarter of 2021.
Sources: Blue Vault, SEC, individual REIT websites, NAREIT