Arpita Banerjee and Ronamil Portes | S&P Market Intelligence
US home prices continued their upward trend in September, reflecting a persistent shortage of housing inventory and high mortgage rates.
The S&P CoreLogic Case-Shiller US National Home Price NSA Index, covering all nine US census divisions, rose 3.9% year over year in September, up from a 2.5% annual increase in the previous month after seasonal adjustment.
The 10-City Composite increased 4.8% year over year in September, up from a 3.0% annual increase in August. The 20-City Composite recorded an annual increase of 3.9%, up from a 2.1% increase in the previous month.
On a month-over-month basis, the US National Index, 10-City Composite and 20-City Composite each posted increases of 0.7% after seasonal adjustments.
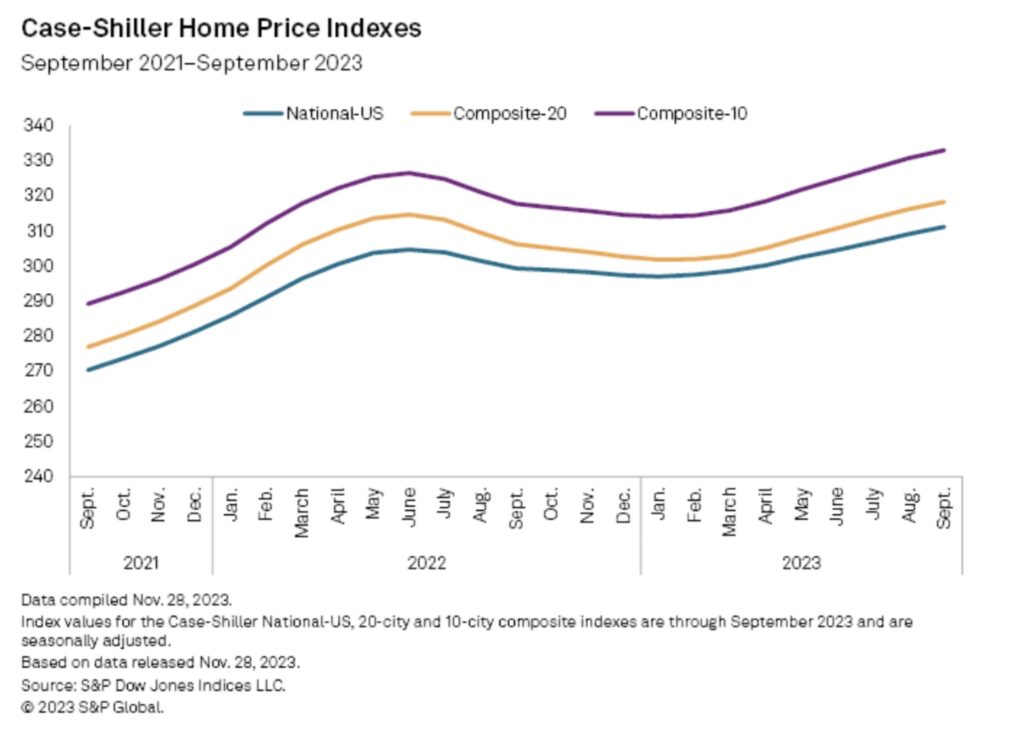
“We’ve commented before on the breadth of the housing market’s strength, which continued to be impressive,” Craig Lazzara, managing director at S&P Dow Jones Indices, said in a Nov. 28 release. “Although this year’s increase in mortgage rates has surely suppressed the quantity of homes sold, the relative shortage of inventory for sale has been a solid support for prices.”
Among the 20 cities in the index, Detroit posted the highest price gain on a year-over-year basis at 6.7%, followed by San Diego at 6.5% and New York 6.3%. Three of the 20 cities posted lower prices year over year in September, with Las Vegas recording the highest price decline, at 1.9%, followed by Phoenix and Portland.
Mortgage rates cool in November
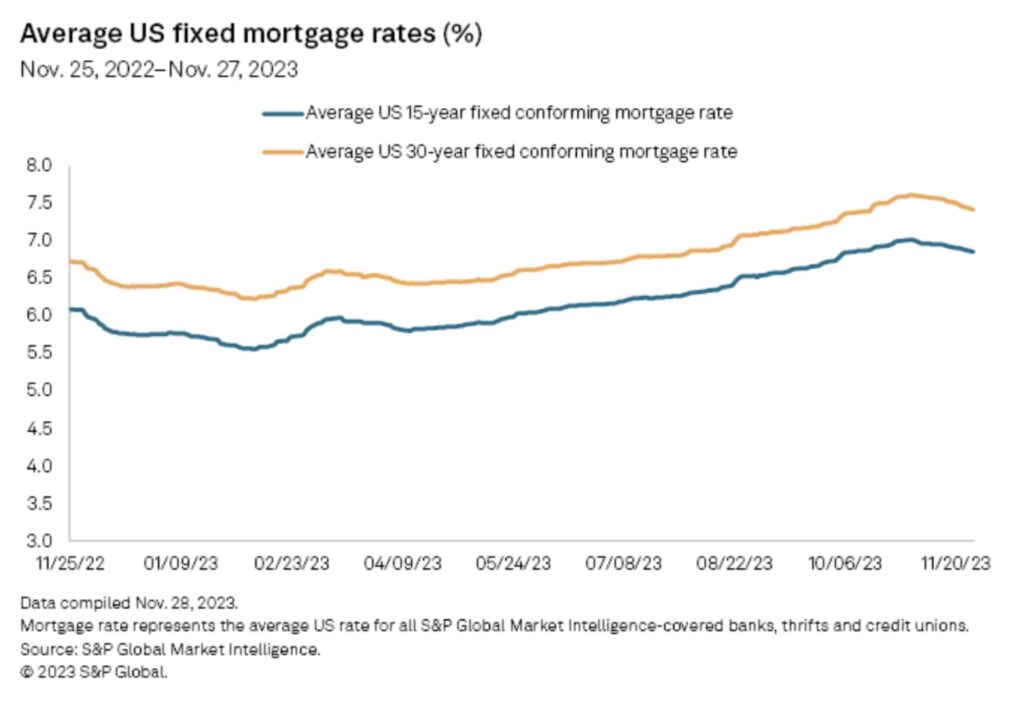
US mortgage rates continued to inch lower in November as Treasury market yields, which act as a benchmark for mortgage rates, declined due to cooling inflation.
The average US 30-year fixed conforming mortgage rate stood at 7.42% as of Nov. 27, a 17-basis-point decline from the 7.59% recorded on Oct. 27.
The average US 15-year fixed-conforming mortgage rate was 6.86% on Nov. 27, a 14-basis-point sequential decline.
Higher mortgage rates weigh on home sales
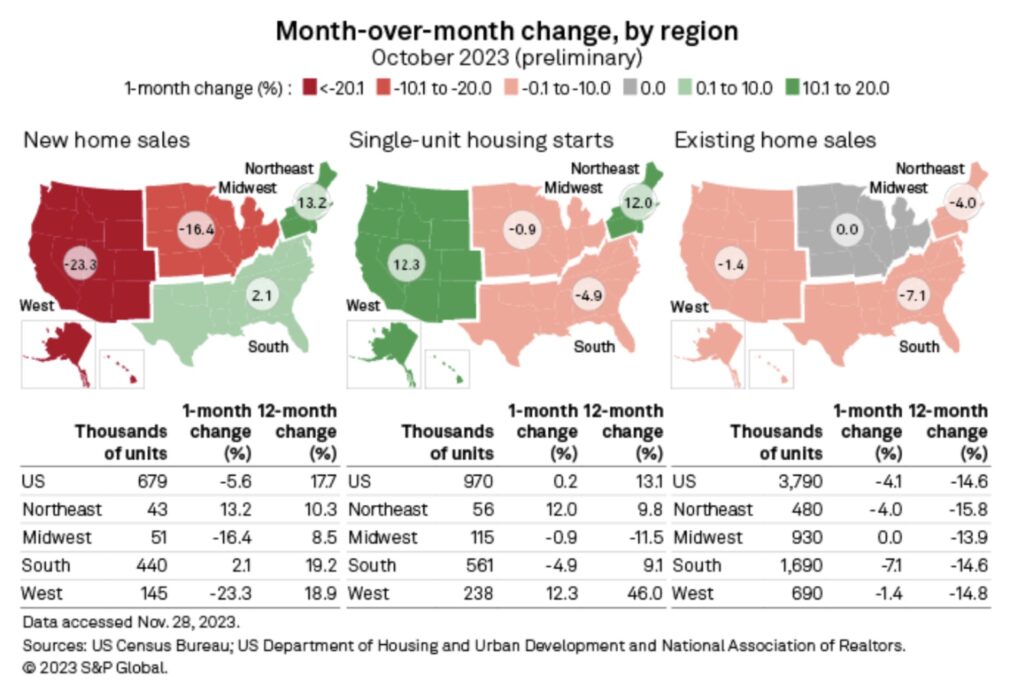
Existing home sales continued to decline in October, falling 4.1% month over month to a seasonally adjusted annual rate of 3.79 million units, according to data from the National Association of Realtors. Sales declined 14.6% from a year earlier.
“Prospective home buyers experienced another difficult month due to the persistent lack of housing inventory and the highest mortgage rates in a generation,” Lawrence Yun, chief economist at the National Association of Realtors, said in a Nov. 21 news release. “Multiple offers, however, are still occurring, especially on starter and mid-priced homes, even as price concessions are happening in the upper end of the market.”
All US regions posted year-over-year declines in existing home sales. The Northeast had the highest year-over-year decrease in existing home sales, at 15.8%.
On a month-over-month basis, existing homes sales in the Midwest remained unchanged at 930,000 units, while the other regions logged sequential declines.
In October, the median US existing-home price rose 3.4% year over year to $391,800, according to the National Association of Realtors.
New home sales declined 5.6% in October to a seasonally adjusted annual rate of 679,000 units, according to data from the US Census Bureau and the Department of Housing and Urban Development. However, this marked a 17.7% increase from the October 2022 estimate of 577,000 units.
The Northeast posted the highest sequential increase in new home sales, at 13.2%. The South logged the highest year-over-year increase in new home sales, at 19.2%.
Source:
S&P Global Market Intelligence