How to Answer the Most Basic Questions About Nontraded REITs
May 22, 2018 | James Sprow | Blue Vault
Imagine that you are the type of financial advisor or individual investor who wants to do your own research on a nontraded REIT program, either a program in which you already have invested or are considering for future investment. Some of the basic questions you may want to answer might be:
What’s the current offering price for the different share classes available and what are the associated fees?
What is the current distribution yield for the different share classes, after deducting any trailing shareholder servicing or distribution fees?
For the closed nontraded REIT offering what is the most recent estimated NAV per share and how was it determined?
If you don’t have a Blue Vault Partners Nontraded REIT Industry Review or do not have access to the research on our website at www.bluevaultpartners.com, here’s what you might confront as you try to answer those three questions.
Current Offering Prices and Fees
When a 10-Q or 10-K report is filed with the SEC for an effective nontraded REIT program, it may or may not be easy to discover the current offering prices and fees. For example, in the most recent 10-Q filed by Blackstone REIT, there is no mention of pricing or fees. However, on May 17, the REIT filed a report designated as “424b3” in which the REIT reports the pricing of its shares beginning June 1, 2018. For this REIT offering, the actual transaction price will be the April 30, 2018 NAV per share plus applicable fees, such as the upfront selling commissions and dealer manager fees. Those important upfront fees are not detailed in the SEC filing. The best source for current pricing for this particular REIT is at their website at www.breit.com. The websites for nontraded REITs with open offerings should have the most recent pricing information.
At the Blackstone REIT website, on page 10 of the offering brochure, we find the fees that are applied to each share class:
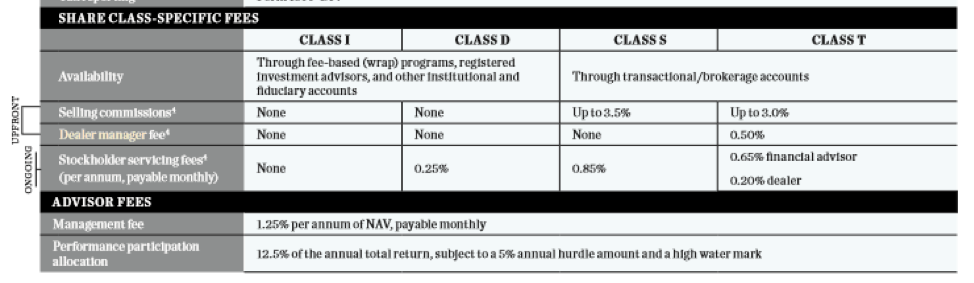
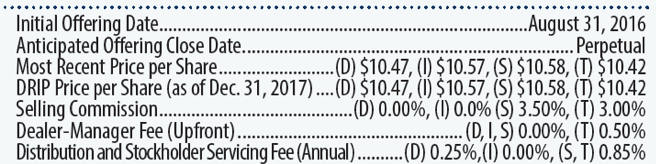
Blue Vault reports the most recent NAV and the fees related to each class of shares in each NTR Industry Review quarterly report. For example, here’s the information on the Q1 2018 page for Blackstone REIT:
Current Distribution Yields After Related Fees
Many nontraded REITs declare distributions using daily rates, before fees. One must then convert the daily rates into annualized rates and choose a denominator to calculate the percentage rate. For most REITs, a reasonable denominator would be the original offering price, but some offerings have changing prices which result in differing yield calculations.
For example, Carter Validus Mission Critical REIT II reports on page 23 of its Q1 2018 10-Q:
On May 3, 2018, the board of directors of the Company approved and authorized a daily distribution to the Company’s Class A … commencing on June 1, 2018, and ending on August 31, 2018. The distribution will be calculated based on 365 days in the calendar year and will be equal to $0.001788493 per share of Class A common stock, which will be equal to an annualized distribution rate of 6.40%, assuming a purchase price of $10.200 per share of Class A common stock.
The rate for Class T shares is sometimes reported before the trailing shareholder servicing fees, and sometimes net of those fees. The reader must read closely to know how the declared distributions are reported.
Another sponsor declares its distributions as a monthly rate. For example, Hines Global Income:
With the authorization of our board of directors, we declared monthly distributions from January 2018 through March 31, 2018, at a gross distribution rate of $0.05083 per month for each share class less any applicable distribution and stockholder servicing fees.
Blue Vault reports the distribution rates for each share class on an annualized basis, net of fees. Here’s the Q4 2018 report for Hines Global Income’s distributions.
Most Recent Estimated NAV Per Share
There are many details that go into the estimated NAVs (net asset values) per share that are announced by nontraded REIT programs. While most nontraded REITs announce an estimated NAV per share annually, not all REITs announce their NAVs to be effective as of the same date. Locating the most recent estimated NAV per share isn’t always easy. For example, a closed REIT mentions its NAV per share just once in its most recent Q1 2018 10-Q and doesn’t note the “as of” date.
“The Company has registered $311.9 million in shares of its common stock to be sold pursuant to its distribution reinvestment plan and is offering the shares at a price equal to the net asset value (“NAV”) per share most recently disclosed by the Company, which is presently $11.11 per share.”
This REIT reports in its 2017 10-K more information about its estimated NAV per share:
“On December 14, 2017, our board of directors unanimously approved an estimated NAV of our common stock of $11.11 per share based on the number of shares issued and outstanding as of November 30, 2017.”
Using the December 14, 2017 date, a search on the SEC website results in an 8-K filed on December 18, 2017, that gives the details for the NAV estimate.
It is difficult to make apples-to-apples comparisons when nontraded REITs have many different “as of” dates for their estimated NAVs. For example, in the Q4 2018 NTR Review, the dates for the most recent NAVs include “as of” dates from March, April, May, June, October, November, and December.
When nontraded REITs follow IPA guidelines in estimating their NAVs, they will utilize a third-party appraisal and include a sensitivity analysis that illustrates the effects of different assumptions on the estimated values. The third party presents the independent directors of the board with a high and low estimated NAV per share that can vary significantly. For example, Healthcare Trust announced an estimated NAV per share on March 30, 2018, based upon a range of values prepared by Duff & Phelps. That range was from a low of $18.38 to a high of $20.55. The board chose a value of $20.25, near the high end of the value range. The large majority of nontraded REIT boards use the midpoint of the range prepared by the independent third-party, which in the case of Healthcare Trust would be $19.47. Interestingly, one of the factors the board of Healthcare Trust considered in selecting the higher NAV was their plan to reduce the distribution rate for common shareholders.
Conclusion
Given the difficulties encountered when seeking answers to the most basic questions related to nontraded REITs, the best approach is to start with Blue Vault’s quarterly Nontraded REIT Industry Review. For each nontraded REIT, offering prices, fees, distribution yields and recent NAVs are all reported on the REIT’s report page.
Sources: SEC, www.breit.com, Blue Vault