Most DST due diligence starts with the offering in front of the advisor: the property, projected distribution, leverage, tenants and exit strategy. Those factors matter. But they describe the current program – not the sponsor’s history.
A DST offering may be new. The sponsor is not.
Blue Vault’s closed and full-cycle DST data adds another layer to the review process by helping advisors examine what happened across prior programs, how consistently projected distributions were maintained, what happened at exit, and how much sponsor equity is tied to programs currently falling short of original distribution projections.
|
EXPLORE DSTs IN BLUE VAULT Financial professionals can research current DST programs AND historical sponsor performance in the Blue Vault portal. Current offering details are not included in the public analysis you are viewing. |
Four Questions to Ask About the Sponsor
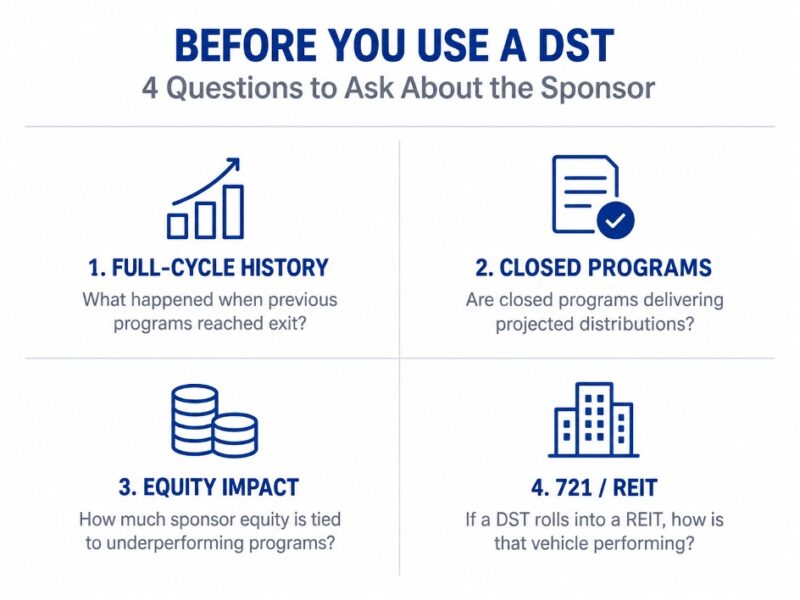
Before relying on a single current offering, advisors can use sponsor history to ask four broader questions:
1. Are Closed Programs Delivering the Distributions Originally Projected?
For this analysis, Blue Vault classifies a closed DST as underperforming when its actual distribution rate is below its projected distribution rate. That is a deliberately narrow definition. It does not mean investors have experienced a loss, and it does not measure total return or the eventual full-cycle outcome.
Even with that narrow definition, the selected sponsor results vary materially. ExchangeRight currently has 0.0% of tracked closed programs classified as underperforming. Capital Square is at 18.2%, Inland at 28.6%, Passco at 50.0%, and NexPoint at 63.0%.
2. How Much Sponsor Equity Is Associated With Those Programs?
Program counts do not always tell the entire story. A sponsor could have several smaller underperforming programs and one large program performing as projected – or the reverse. Blue Vault therefore also looks at the share of closed sponsor equity associated with programs currently below their projected distribution rates.
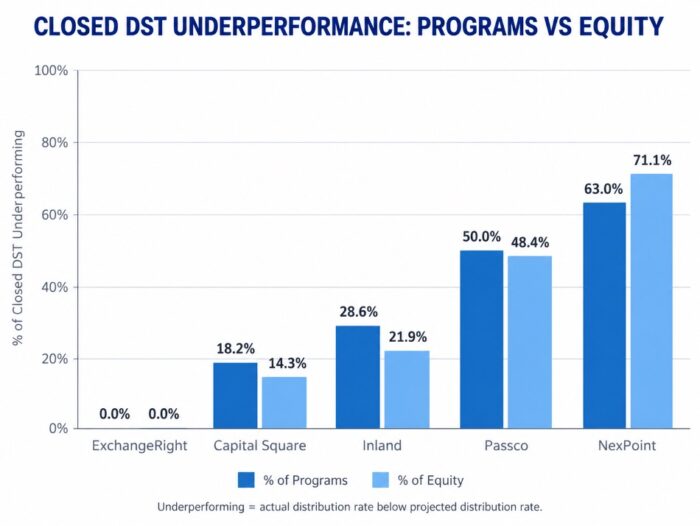
The difference is particularly visible for NexPoint: 63.0% of tracked closed programs are classified as underperforming, while those programs represent approximately 71.1% of the closed equity captured in the Blue Vault dataset. Passco is at 50.0% of programs and 48.4% of equity; Inland at 28.6% and 21.9%; and Capital Square at 18.2% and 14.3%, respectively.
This is why equity-weighted underperformance can be a useful second lens. It helps an advisor distinguish between the number of challenged programs and the amount of capital associated with them.
3. What Happened When Prior DSTs Actually Reached Exit?
Closed-program distribution performance is only one stage of the investment lifecycle. Full-cycle results allow advisors to ask a different question: what happened when the property or program ultimately reached disposition?
One Blue Vault measure compares the eventual sale price with the original offering price. We also apply a more conservative test that reduces the sale price by an assumed 3% selling cost before making that comparison.
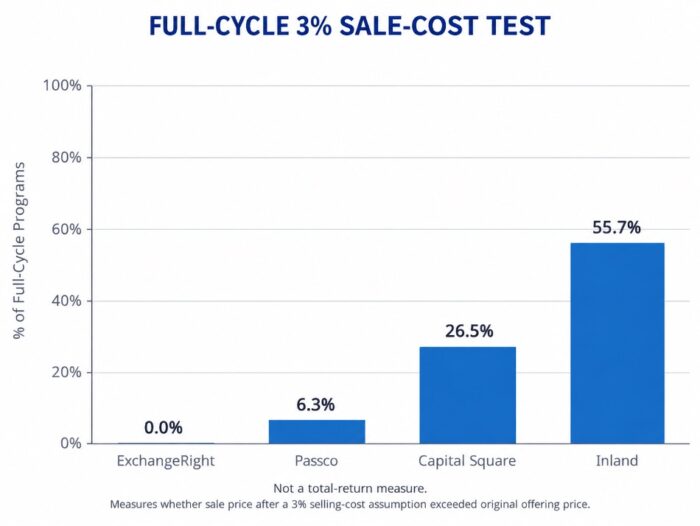
Under that 3% selling-cost test, the selected sponsor results range from 0.0% for ExchangeRight to 6.3% for Passco, 26.5% for Capital Square and 55.7% for Inland.
|
IMPORTANT: THIS IS NOT A TOTAL-RETURN MEASURE The full-cycle sale-price test does not include distributions received during the holding period. It should not be described as the percentage of investors who “lost money” or the percentage of programs that produced a negative total return. It is specifically a comparison of sale proceeds, after the assumed selling cost, with original offering price. |
4. One Metric Can Tell a Very Different Story From Another
Passco provides a useful example of why sponsor due diligence should not rely on a single statistic. In the Blue Vault full-cycle dataset, 0.0% of Passco’s tracked programs failed to clear original offering price based on gross sale price, while 6.3% failed to clear it after the 3% selling-cost assumption. Yet 50.0% of Passco’s tracked closed DSTs are currently distributing below their original projected distribution rates.
Those statistics are not contradictory. They measure different stages of the investment lifecycle. Current distribution performance can be weaker even when historical disposition results look stronger – and vice versa.
That is the broader point: a sponsor’s history is better understood through multiple measures than through a single average, one successful program, or one challenged program.
5. If the destination is a REIT, the due diligence should continue
Some DST strategies include a potential path to a REIT through a 721 exchange. When that is part of the strategy, evaluating the DST itself is only part of the analysis. The advisor should also understand the financial condition and distribution coverage of the REIT investors may ultimately own.
ExchangeRight provides a useful example. For certain ExchangeRight DST programs with a 721 strategy, the potential destination vehicle is ExchangeRight Essential Income REIT. Using Blue Vault’s REIT methodology, Essential Income REIT reported a Q2 2026 MFFO/AFFO payout ratio of 96.6%, improving from 98.9% in Q1. Because Blue Vault considers a payout ratio of 100% or less fully covered, the REIT’s Q2 distribution was fully covered by MFFO/AFFO. The longer-term picture is also favorable: cumulative distributions paid represented 89.1% of cumulative MFFO/AFFO since inception through Q2 2026.
That matters because the analysis should not end with the DST’s projected exit strategy. If an investor may ultimately own shares of a REIT, advisors should also evaluate the destination vehicle’s distribution coverage, leverage, portfolio performance, liquidity and overall financial condition.
The point: A 721 strategy can extend the investment lifecycle well beyond the original DST. Sponsor due diligence should therefore consider both the sponsor’s DST history and the health of the vehicle investors may eventually own.
Note: Not every ExchangeRight DST necessarily results in a 721 exchange. The REIT analysis is relevant where a specific DST includes a 721 pathway.
ExchangeRight source: https://www.exchangeright.com/the-essential-income-reit/
What These Numbers Do – and Do Not – Tell You
Historical sponsor data can help an advisor identify questions worth asking, but it is not a standalone recommendation. Sponsor observation counts differ, property types and vintages differ, market environments differ, and Blue Vault’s historical datasets may not capture every program ever completed by a sponsor.
The data also should not be used to label a sponsor simply “good” or “bad.” A sponsor can have strong full-cycle disposition results while experiencing weaker current distribution performance, or the reverse. The value comes from understanding the range and consistency of outcomes and then drilling into the underlying programs.
For Advisors: Know More Than the Offering in Front of You
The current offering tells you what is being presented today. The sponsor’s history helps you understand what happened before.
Blue Vault gives qualified financial professionals access to closed-program performance, full-cycle outcomes, comparative sponsor analysis and research on current DST programs.
CONTINUE THE ANALYSIS IN BLUE VAULTAfter logging in, go to the DST section and begin with Comparative Analysis. From there, review the Closed DST and Full-Cycle data to drill into sponsor and individual program history. Current DST programs can also be researched within the DST section. Already have Blue Vault access?Log in to explore current DST offerings, standardized metrics, sponsor history and full-cycle outcomes. Not yet subscribed?Financial advisors can access Blue Vault at no cost.
|
Source & Methodology
- Blue Vault DST data is compiled from sponsor-issued source materials available to Blue Vault, including offering, closing, disposition and other sponsor-provided reporting. Blue Vault does not independently audit sponsor-reported information.
- For this analysis, a closed DST is classified as underperforming when its actual distribution rate is below its projected distribution rate. This classification does not indicate total return, investor loss or ultimate full-cycle outcome.
- The full-cycle 3% sale-cost measure compares sale price after an assumed 3% selling cost with original offering price. It does not include distributions received during the holding period and is not a total-return calculation.
- Historical comparisons reflect information available to Blue Vault and may not represent every DST program completed by a sponsor. Observation counts, investment periods, property types, leverage, market environments and other characteristics may differ materially among sponsors.
- Historical results are for informational purposes only and are not indicative of future performance. Blue Vault does not provide investment advice.
Information is intended only for institutional, broker dealer or registered investment adviser use. This information is prohibited for use by the general public. Past performance is not indicative of future results.