
Are BDC Investors Buying Performance or Something Else?
Blue Vault recently reported that comparable BDC gross capital raise declined from approximately $5.33 billion in Q1 to $2.61 billion in Q2 — a 51% decrease.
But knowing where sales moved led to another question:
What actually appears to be associated with BDC capital raise?
Blue Vault compared Q2 gross capital raise with several commonly watched BDC metrics, including total assets, distribution rate, ROE, trailing returns and distribution coverage.
The results suggest the traditional sales leaderboard tells only part of the story.
Scale had by far the strongest relationship with absolute capital raise.
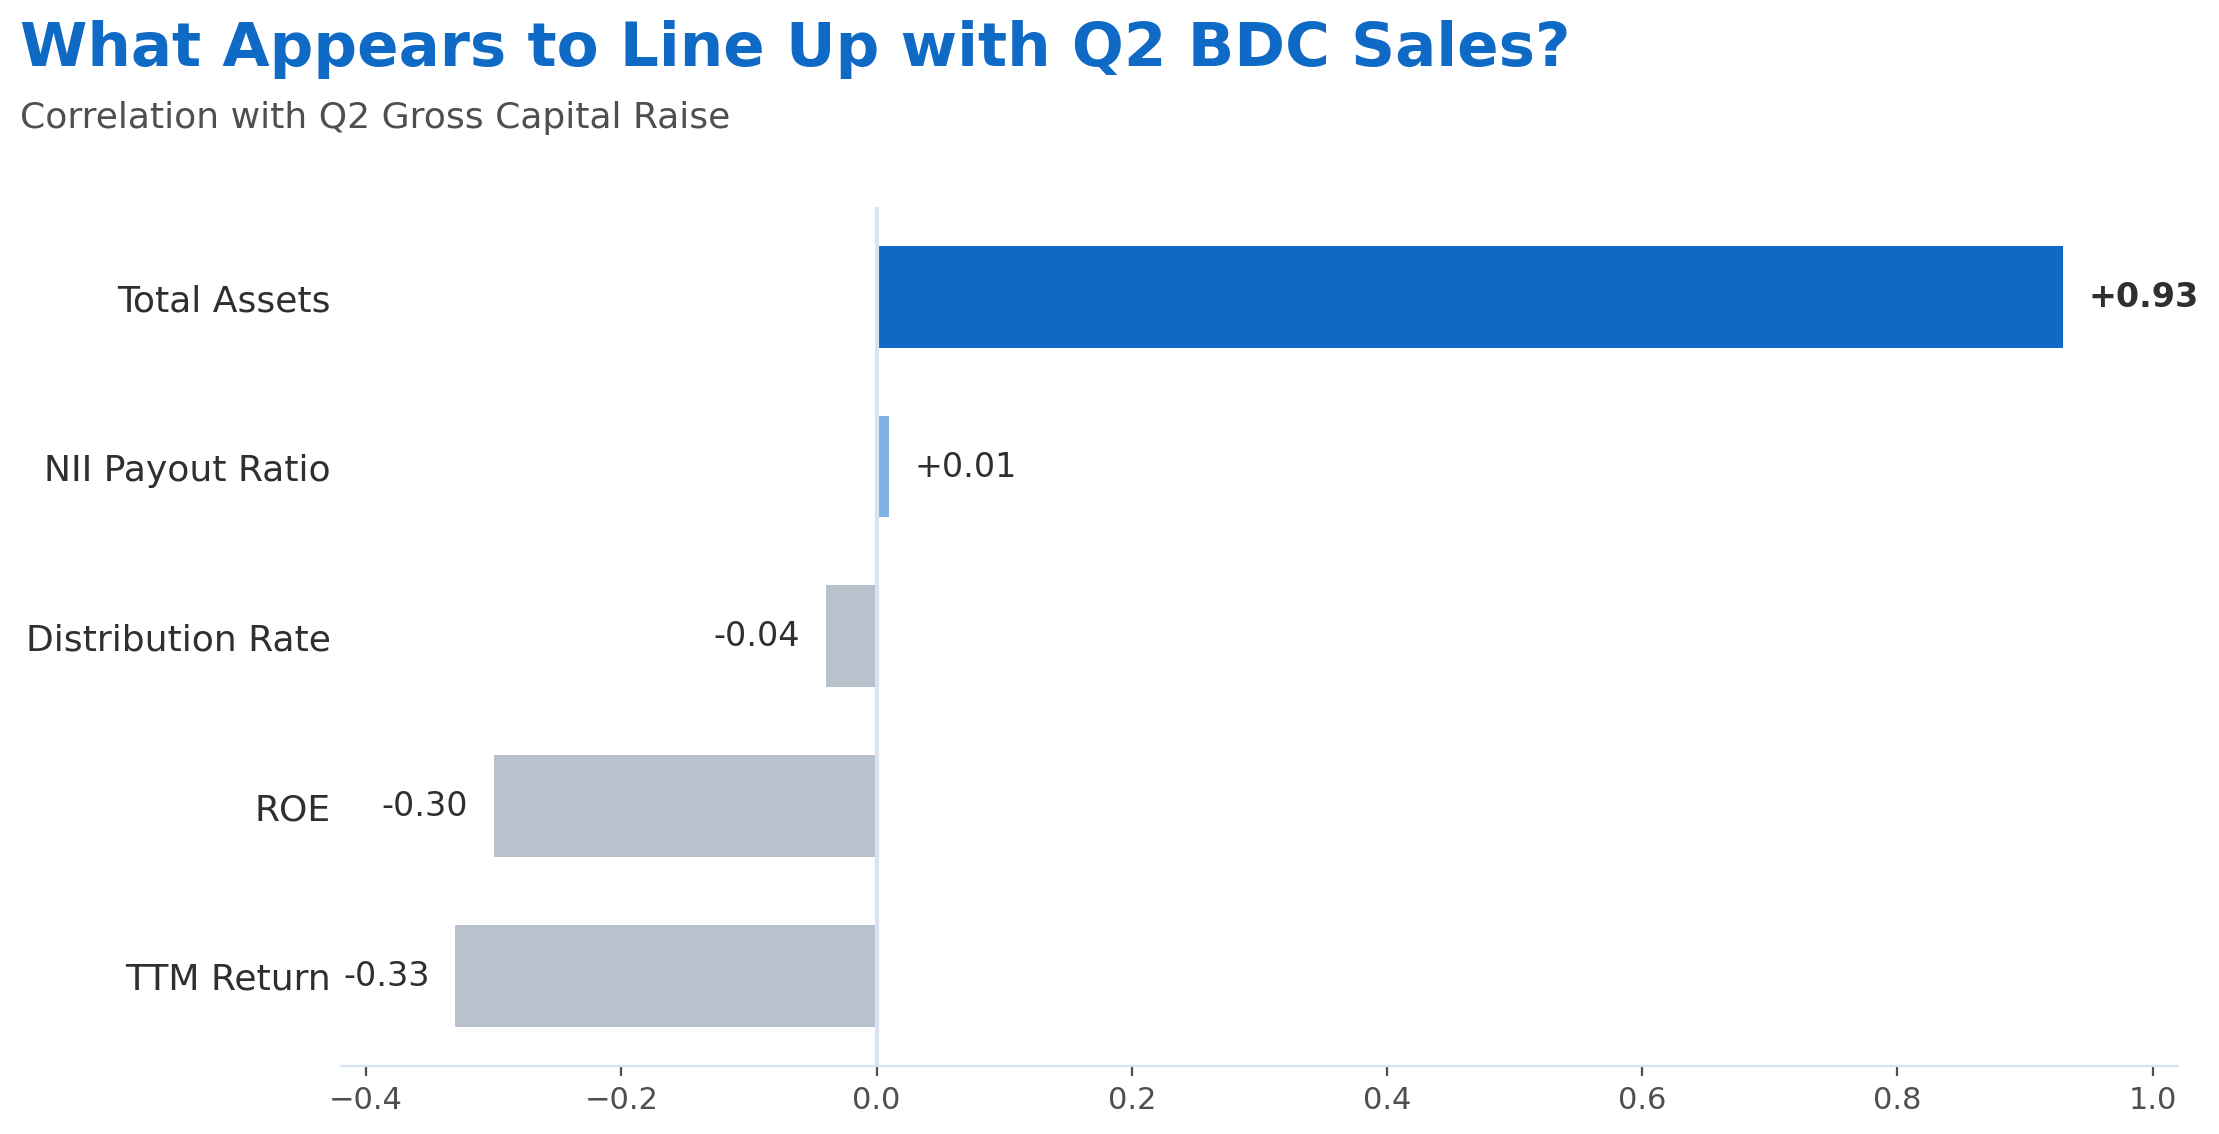
The correlation between total assets and Q2 gross capital raise was 0.93. For context, a correlation of 1.00 would represent a perfect positive relationship.
Other metrics showed far weaker relationships with absolute Q2 capital raise:
| Metric | Correlation with Q2 Gross Capital Raise |
|---|---|
| Total Assets | +0.93 |
| Distribution Rate | −0.04 |
| NII Payout Ratio | +0.01 |
| ROE | −0.30 |
| TTM Return | −0.33 |
These figures should not be interpreted to mean weaker performance causes higher sales. Correlation does not establish causation. Capital raise can also be influenced by factors including distribution reach, platform availability, brand recognition, fund age, fundraising stage and advisor access.
Absolute BDC capital raise in Q2 was much more closely associated with fund size than with yield, ROE, coverage or recent return.
Were the biggest sellers also the best performers?
Not necessarily.
Blue Vault compared the five largest Q2 capital raisers with the remaining BDCs reporting positive capital raise.
| Metric | Top 5 Capital Raisers | Remaining BDCs |
|---|---|---|
| TTM Return | 6.44% | 6.43% |
| Quarterly Return | 1.87% | 2.02% |
| ROE | 3.44% | 4.75% |
| Distribution Rate | 9.52% | 9.24% |
The largest capital raisers therefore did not stand apart based on higher distributions or stronger recent performance.
But what happens when we adjust for fund size?
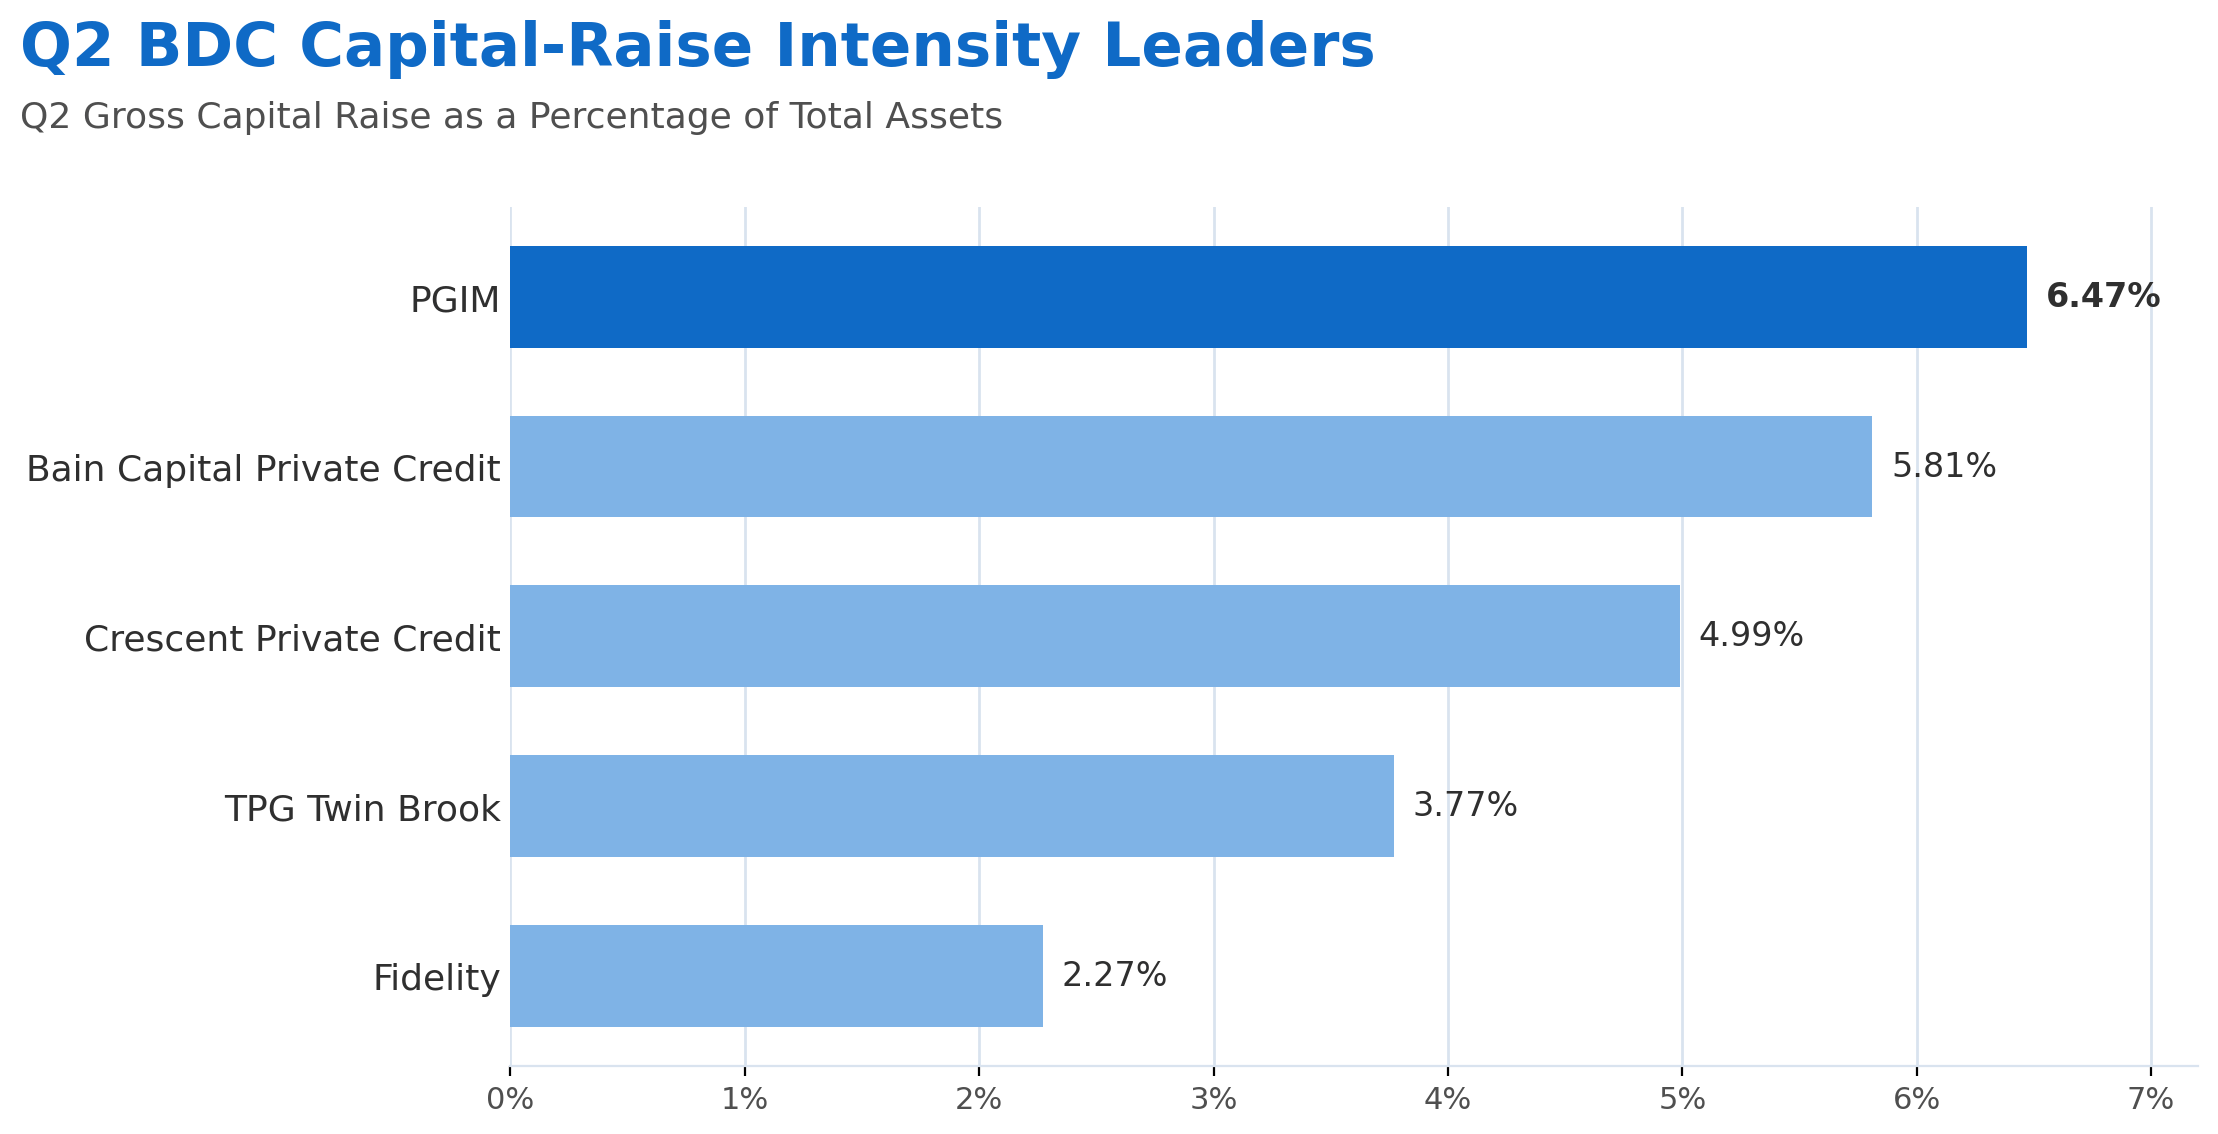
This is where the analysis becomes more interesting. Absolute capital raise naturally favors larger funds. So Blue Vault also examined capital raised relative to each BDC’s existing asset base. We refer to this as capital-raise intensity.
The Q2 leaders on this measure were:
| BDC | Q2 Capital Raise as % of Assets |
|---|---|
| PGIM | 6.47% |
| Bain Capital Private Credit | 5.81% |
| Crescent Private Credit | 4.99% |
| TPG Twin Brook | 3.77% |
| Fidelity | 2.27% |
This produces a very different leaderboard from absolute capital raise. And that’s where performance becomes much more visible.
The high-intensity raisers showed stronger performance characteristics.
For the five BDCs with the highest Q2 capital-raise intensity:
| Metric | High-Intensity Top 5 | Remaining Positive Raisers |
|---|---|---|
| ROE | 8.68% | 3.80% |
| TTM Return | 9.40% | 6.43% |
| Quarterly Return | 2.29% | 1.96% |
| Distribution Rate | 8.69% | 9.26% |
The funds raising the most capital relative to their existing asset bases actually had a lower median distribution rate, while showing stronger median ROE and trailing returns.
So are BDC investors buying performance?
The Q2 data doesn’t support a simple yes-or-no answer.
Scale appears to have an enormous influence on absolute capital raise.
The largest funds tend to raise the largest dollar amounts.
But when Blue Vault adjusts capital raise for the size of the existing fund, performance becomes considerably more visible.
And one factor that did not stand out?
Distribution rate alone.
That matters because it challenges the assumption that the highest-yielding BDCs necessarily attract the most capital.
The better question may be:
Which BDCs are raising more capital than their existing size would suggest?
That’s where the Q2 data begins to reveal a different kind of fundraising momentum.
Go Deeper with Blue Vault
Standardized data allows financial professionals to ask questions that can’t be answered by looking at one metric in isolation.
Who raised the most?
Who is raising disproportionately more capital relative to fund size?
And how do those results compare with performance, distributions, coverage and portfolio fundamentals?
Financial advisors can access Blue Vault at no cost.
Already have Blue Vault access?
Log in to explore the underlying BDC fundraising, performance, distribution, coverage and comparative fund data.
Not yet subscribed?
Financial advisors can access Blue Vault at no cost.
Source & Methodology
Blue Vault market statistics are derived from Blue Vault’s proprietary standardized BDC dataset. This analysis compares BDCs with comparable gross capital raise data for Q1 and Q2 2026. Figures may be rounded.
Information is intended only for institutional, broker dealer or registered investment adviser use. This information is prohibited for use by the general public. Past performance is not indicative of future results.