Blue Vault’s Prospect Capital Corporation Analysis
August 11, 2022 | James Sprow | Blue Vault
![]()
This article was originally published August 11, 2022. Updated August 24, 2022
Prospect Capital Corp. is a publicly traded Business Development Company (“BDC”) that invests in middle-market companies located in the US and Canada. The fund targets companies operating in the fields of manufacturing, industrials, energy, business services, financial services, food, healthcare, and media. It provides financing for refinancing, leveraged buyouts, acquisitions, recapitalizations, later-stage growth investments and capital expenditures. It makes investments in the form of first-lien senior loans, second-lien senior loans, mezzanine debt and equity. It also acquires controlling stakes.
The BDC invests primarily in first and second lien secured loans, which in some cases includes an equity component. First and second lien secured loans generally are senior debt instruments that rank ahead of unsecured debt of a given portfolio company. These loans also have the benefit of security interests on the assets of the portfolio company, which may rank ahead of or be junior to other security interests. The investments in collateralized loan obligations (“CLOs”) are subordinated to senior loans and are generally unsecured. The investments have ranged between $5 million and $250 million each, although the investment size may be more or less than this range. The BDC invests in debt and equity positions of CLOs, which are a form of securitization in which the cash flows of a portfolio of loans are pooled and passed on to different classes of owners in various tranches. Its CLO investments are derived from portfolios of corporate debt securities which are mostly risk rated from BB to B.
Prospect Capital is one of the market’s largest business development companies. Over its 18-year business lifetime, it has funded more than 375 investments and currently has $7.5 billion invested across 127 companies.
Prospect Capital (“PSEC”) is listed on the New York Stock Exchange. Over the last year its common stock has traded as high as $9.00 per share (November 2021) and hit a low in June 2022 of $6.66. By August 1 it had recovered to close at $7.73. With its current dividend rate at $0.72 per year, the stock’s dividend yield was 9.31%. The $0.72 annual dividend, paid monthly, has been at the same rate of $0.06 per month since August 2017.
Interesting Metrics for Prospect Capital Corporation
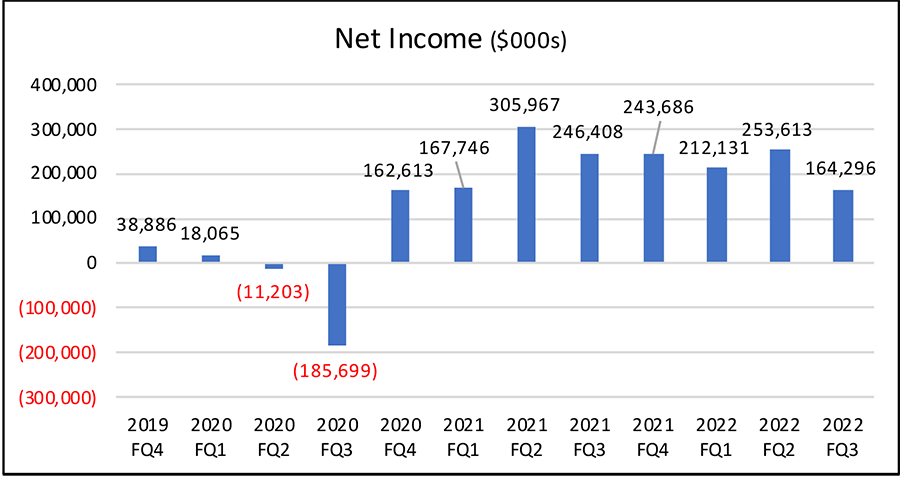
Several metrics that we can examine for the performance of PSEC over the last twelve quarters are not very revealing of any significant changes. For example, from an income perspective, it appears that the BDC has come through the early quarters of the pandemic quite well. For example, net income has bounced back quite well, even though the trends over the last six quarters have not shown an increasing trend. Note that the BDC’s fiscal year ends on June 30, so the most recent quarter is FQ3 2022.
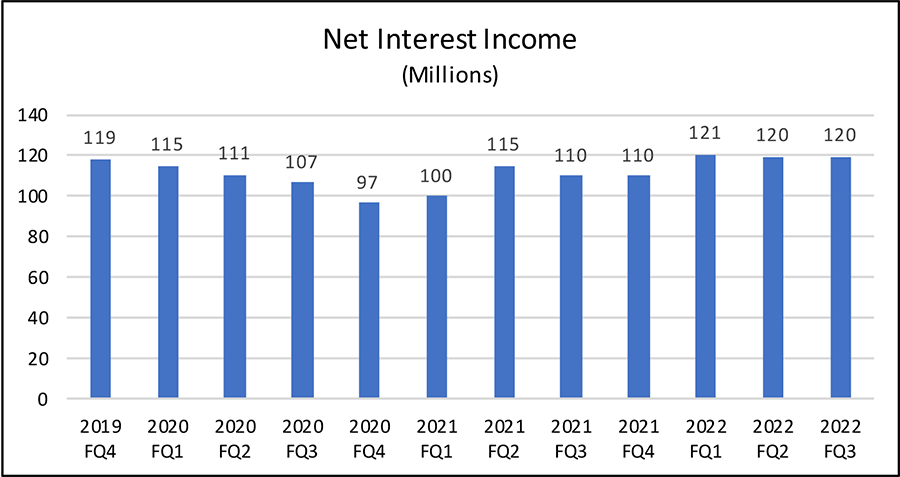
When we look at Net Interest Income, which is the main source of income to the BDC that invests in loans to middle-market businesses, the trend has been relatively positive for the last eight quarters.
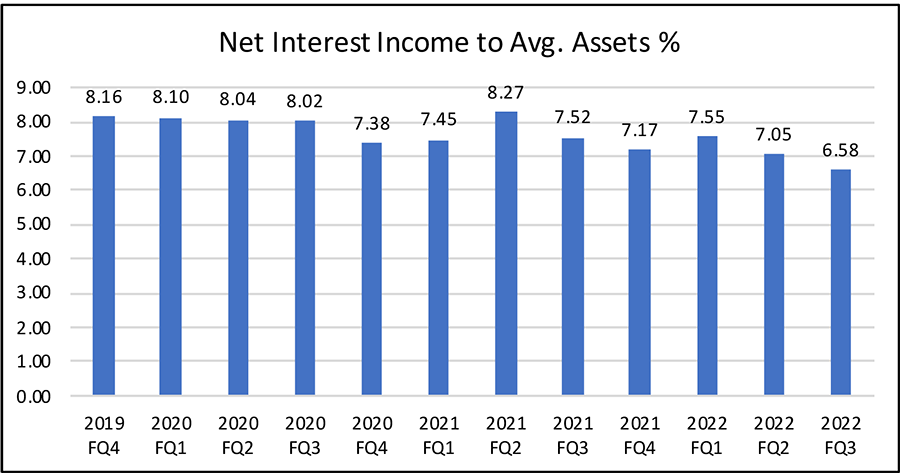
However, the ratio of Net Interest Income to Average Assets has gone down from 8.16 to 6.58, a drop of 158 basis points, which is significant, but the variation from quarter to quarter has not been great. Given that neither the average assets nor the net interest income from the BDC’s portfolio should be expected to vary greatly from quarter to quarter, it makes sense that the ratio has not. Still, the downward trend is noteworthy.
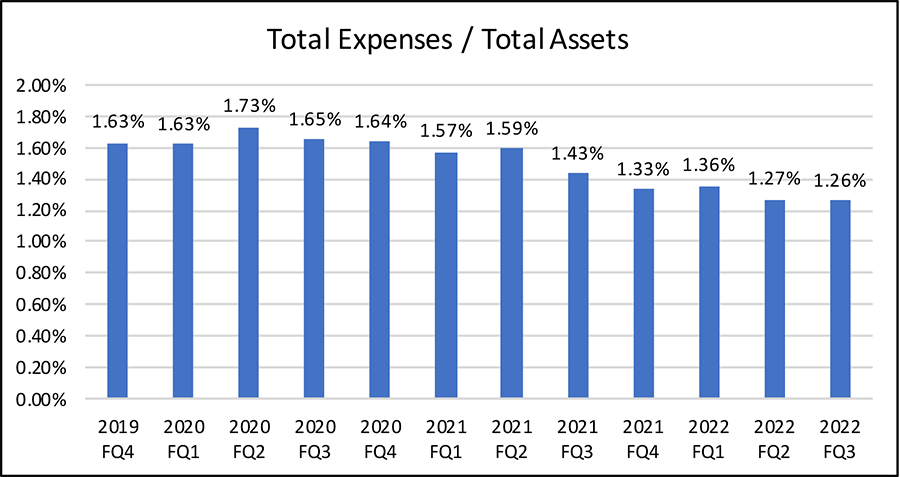
It appears that the Company has managed its expenses well, lowering the ratio of total expenses to total assets significantly. There is variation from quarter to quarter, but the fact that the lowest ratio over the last twelve quarters was the most recent quarter is a positive sign.
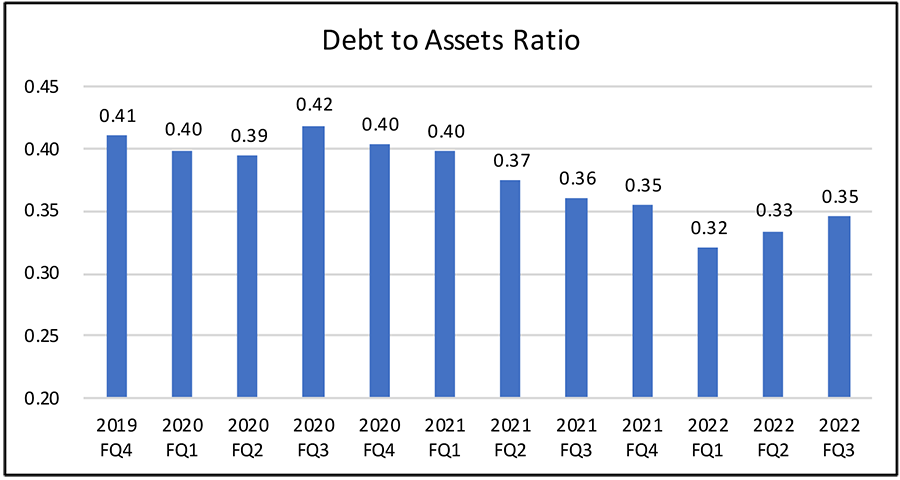
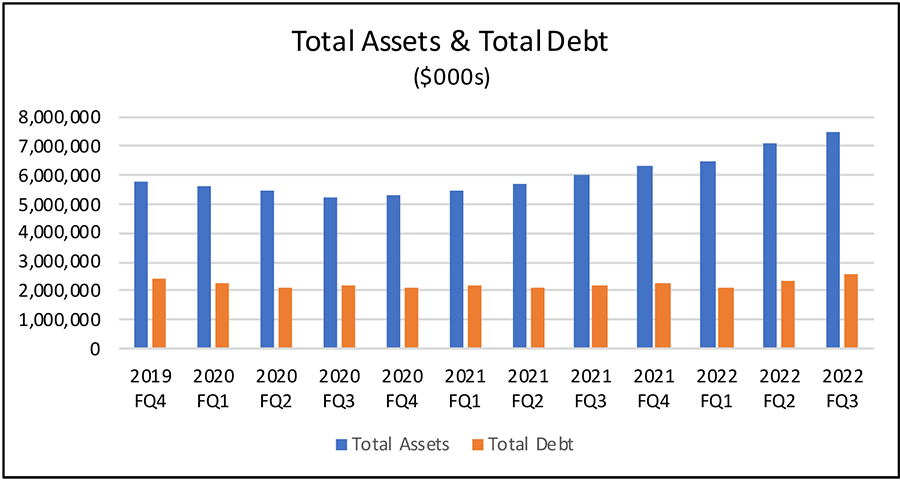
The BDC has steadily lowered its leverage ratio, with the debt/assets ratio going down from 41% in 2019 to 35% in the most recent fiscal quarter, a significant drop. Assets have increased more than debt has increased, as is seen in the following chart.
Due to the way this BDC’s activities are reported in the Statement of Cash Flows, changes in operating assets and liabilities are included in “Operating Activities” rather than “Investment Activities.” This means that two categories of cash flows, “Payments for Purchases of Investments” and “Proceeds from the Sale of Investments and Collection of Investment Principal” are treated as “Operating Activities” rather than “Investment Activities.” The result is a negative impact on “Net Cash Provided by Operating Activities” when total new investments exceed the totals from sales of investments. This means that in quarters when the assets of the BDC are increasing the “Net Cash Provided by Operating Activities” will be negative. Unlike the metrics used in the analysis of REITs, for example, this BDC’s investments are treated as operating cash flows rather than capital investment-related cash flows. GAAP treats investments in loans with four- to six-year maturities, for example, differently than investments in real estate that will be depreciated over 30+ years.
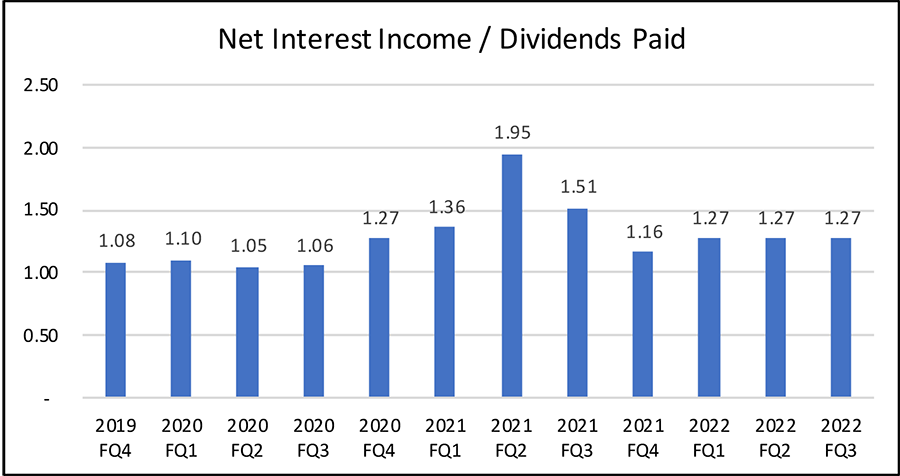
Because of the way GAAP treats investments activity as Operating Activities rather than Investment Activities, and because the BDC does not report metrics that are used in analyzing REIT performance such as FFO and MFFO, a better metric for analyzing the BDC’s performance and dividend sustainability is the ratio of Net Interest Income to Dividends Paid. For PSEC, this ratio has been consistently above 1.0X, meaning that there is a margin of safety when it comes to dividend sustainability.
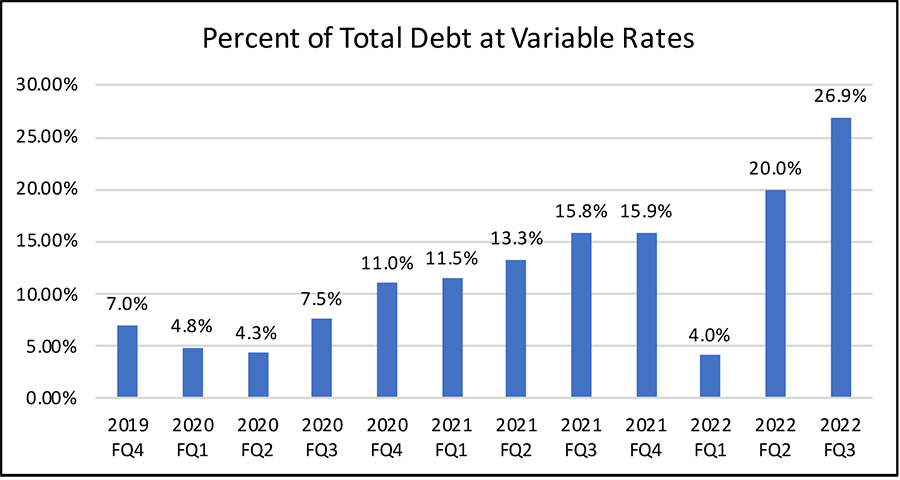
The other interesting trend among the metrics is the increased reliance on variable rate debt. In a time of increasing interest rates, the increased reliance on variable rate debt is potentially worrying. However, to the extent that the BDC’s investments are also at variable rates, this ratio may not be an issue in a rising interest rate environment as those rates affect both assets and liabilities. Indeed, the recent 10-Q states “The senior secured loans underlying the CLOs in which we invest typically have floating interest rates.” Given that a higher percentage of the BDC’s investments are at floating rates than the portion of its borrowings at floating rates, the impact of rising rates on its income is actually positive. The spread between the loan investment floating rates and the BDC’s revolving line of credit, for example, is substantial, resulting in higher net income when market rates rise.
Conclusions
With PSEC’s monthly dividend of $0.06 per share, this July marked the 59th consecutive monthly distribution to shareholders. The dividend yield above 9% places the company among the highest dividend yielding stocks available to investors. According to Morgan Stanley, “Dividend yields can support a stock during a market crash. One thing you cannot fake is cash. When a company mails you a check, the money is yours.” With the relatively positive trends in Net Interest Income PSEC has reported for the past eight quarters, net income has been notably consistent, and positive for the past eight quarters. The ability of its investments to generate interest income more than sufficient to cover dividends has been evident. As a company commits to maintaining a dividend, as PSEC has, it also imposes a discipline on management. As Morgan Stanley has stated, this is one of the psychological restraints that are responsible for the superior returns generated by high dividend paying stocks over long periods of time.
As of May 21, 2020, PSEC has a Dividend Reinvestment Plan (DRIP) that allows stockholders to receive a number of newly-issued shares based upon 95% of the market price of common stock if they are enrolled in the plan. This gives an investor an added incentive to reinvest, and raises the effective dividend yield on shares purchased via the DRIP. On the latest record date for monthly dividends of July 27, the common stock price closed at $7.56, meaning the DRIP price for reinvested dividends in common shares would be approximately $7.18, and the effective dividend yield on those shares would be over 10% annualized, a significant yield by any measure.
Sources: S&P Global Market Intelligence; SEC; Blue Vault; Prospect Capital website
For more insightful data, subscribe to the Blue Vault Database.