Commercial Property Prices: Froth, or Fundamentals?
November 2, 2017 | Calvin Schnure | Nareit
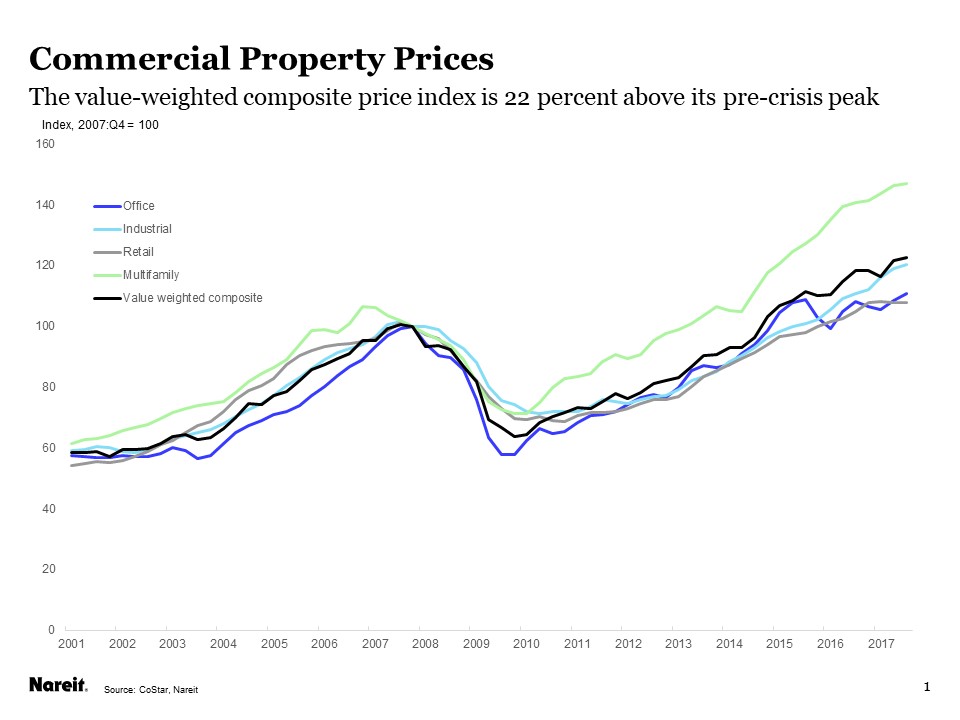
Commercial property prices have risen steadily since the beginning of the recovery from the Great Financial Crisis (GFC). Prices through September were nearly 25 percent above the level at the end of 2007, according to the value-weighted CoStar Commercial Repeat Sales Index, while prices of multifamily properties were nearly 50 percent above their end-2007 value.
Continued price gains, however, at some point begin to raise warning flags. The value-weighted CoStar Composite index has nearly doubled in the seven-plus years since it bottomed out in early 2010, which begs the question, how frothy are property prices? One way to address this issue is to decompose price gains into two components. One part of price increases is that which is supported by rising NOI, while another component results from changes in cap rates. The increases associated with NOI growth have a solid foundation in fundamentals, and generally do not signal trouble ahead. Price increases that result solely or mainly from cap rate declines, however, have proven to be less sustainable over the course of a real estate cycle. Since cap rates are simply the ratio of NOI to property price, the decomposition of price increases into these two components is a straightforward calculation.
Let’s look at a series of four charts that plot the NOI and cap rate components of price increases, calculated from the CoStar data for the national Office, Retail, Apartment and Industrial property markets.


