James Sprow | Blue Vault |
While the stock market has been hammered over the last eight months, with negative returns in five of the eight for the S&P 500, the total returns to common shares in continuously offered nontraded REITs has been positive and substantial in every month, not only for the last eight months, but for every month since March 2020.
For April 2020 the total return to the S&P 500 stock index was negative 8.72%. For February 2020 it was negative 2.99%, following a negative 5.17% total return in January. As this article is being written, the S&P 500 index, representing the 500 most valuable firms listed on the U.S. stock exchanges, was down 19%. Meanwhile, the total returns over the four months since December 31, 2021, for the continuously offered nontraded REITs (also known as “NAV REITs” because they publish their net asset values per share monthly) ranged from 2.05% to 22.32%, with a median total return of 6.48%.
What About Risk?
A commonly used measure of risk is the standard deviation of a series returns. For the continuously offered nontraded REITs, the standard deviations of the monthly total returns since January 2020 ranged from 0.18% to 2.02%. The median standard deviation for the 11 REITs with monthly total returns reported over that time period was 1.28%. Compare this measure of risk to the standard deviation for the S&P 500 index over the same time period of 5.79%. That risk measure is over 4.5 times as high. In March 2020 the total return on the S&P 500 was -12.35%. The worst of the median returns to the 11 nontraded REITs was the only month in which total returns were negative in the 28 months of returns, and that was -0.46%. Again, in April 2022, the total return to the S&P 500 stock index was negative 8.72%, the equivalent of almost 19 times that of the worst month experienced by the nontraded REITs.
Chart I shows the median monthly total returns for the 11 nontraded REITs with continuous offerings and monthly NAVs. These REITs offer improved liquidity via monthly redemptions and those monthly redemptions requests are being fulfilled at consistently high percentages. The monthly total returns to these NAV REITS have increased impressively during the pandemic and into 2022.
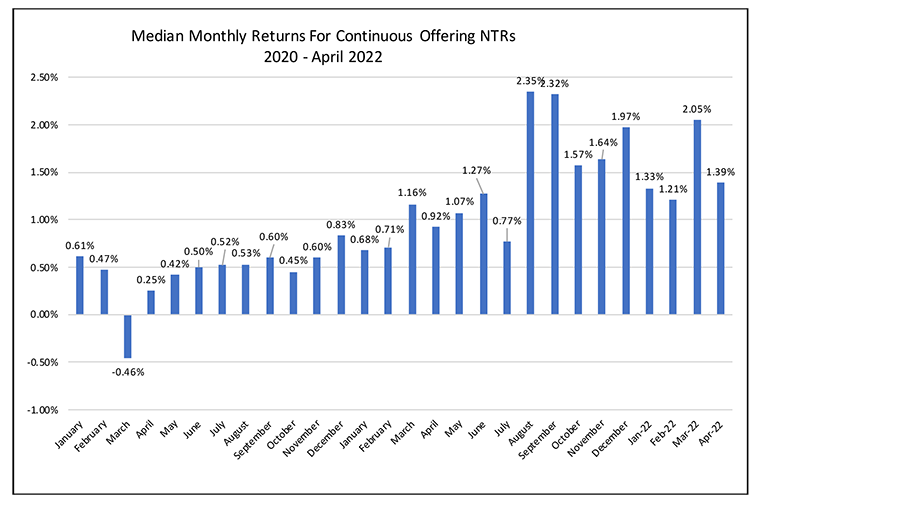
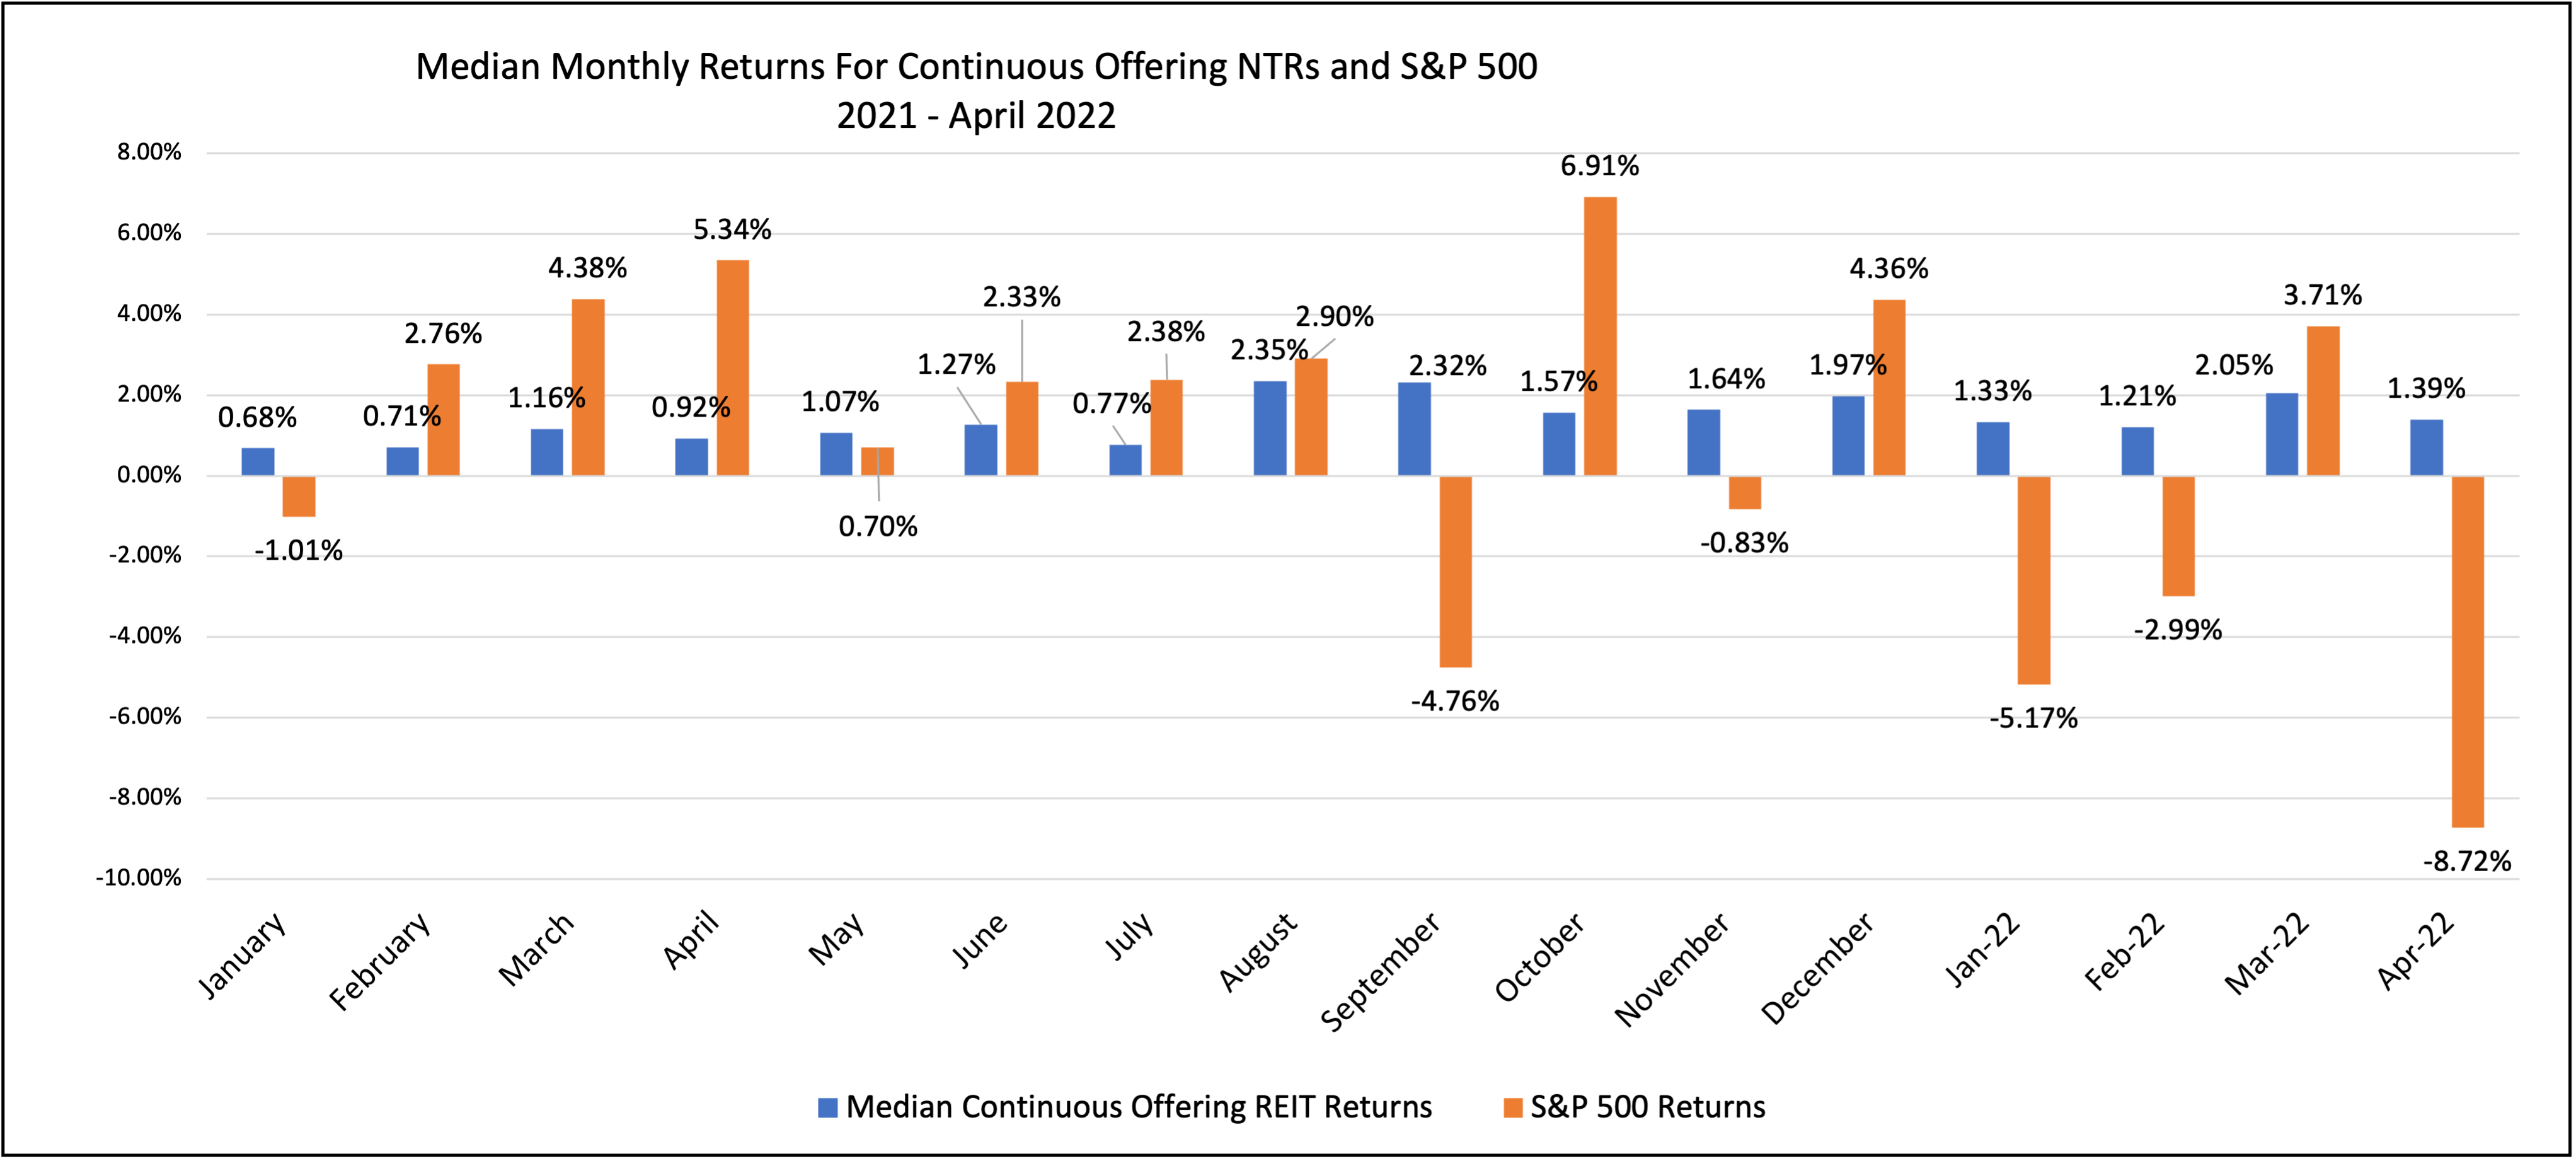
Chart II illustrates the impressively consistent performance of the NAV REITs compared to the total monthly returns for the S&P 500 index of listed stocks over the last 16 months. Note that over this time period the median monthly total returns to the NAV REITs have never fallen into negative territory while the S&P 500 returns have been significantly negative in six of the sixteen months.
April 2022 Total Returns to Nontraded NAV REITs
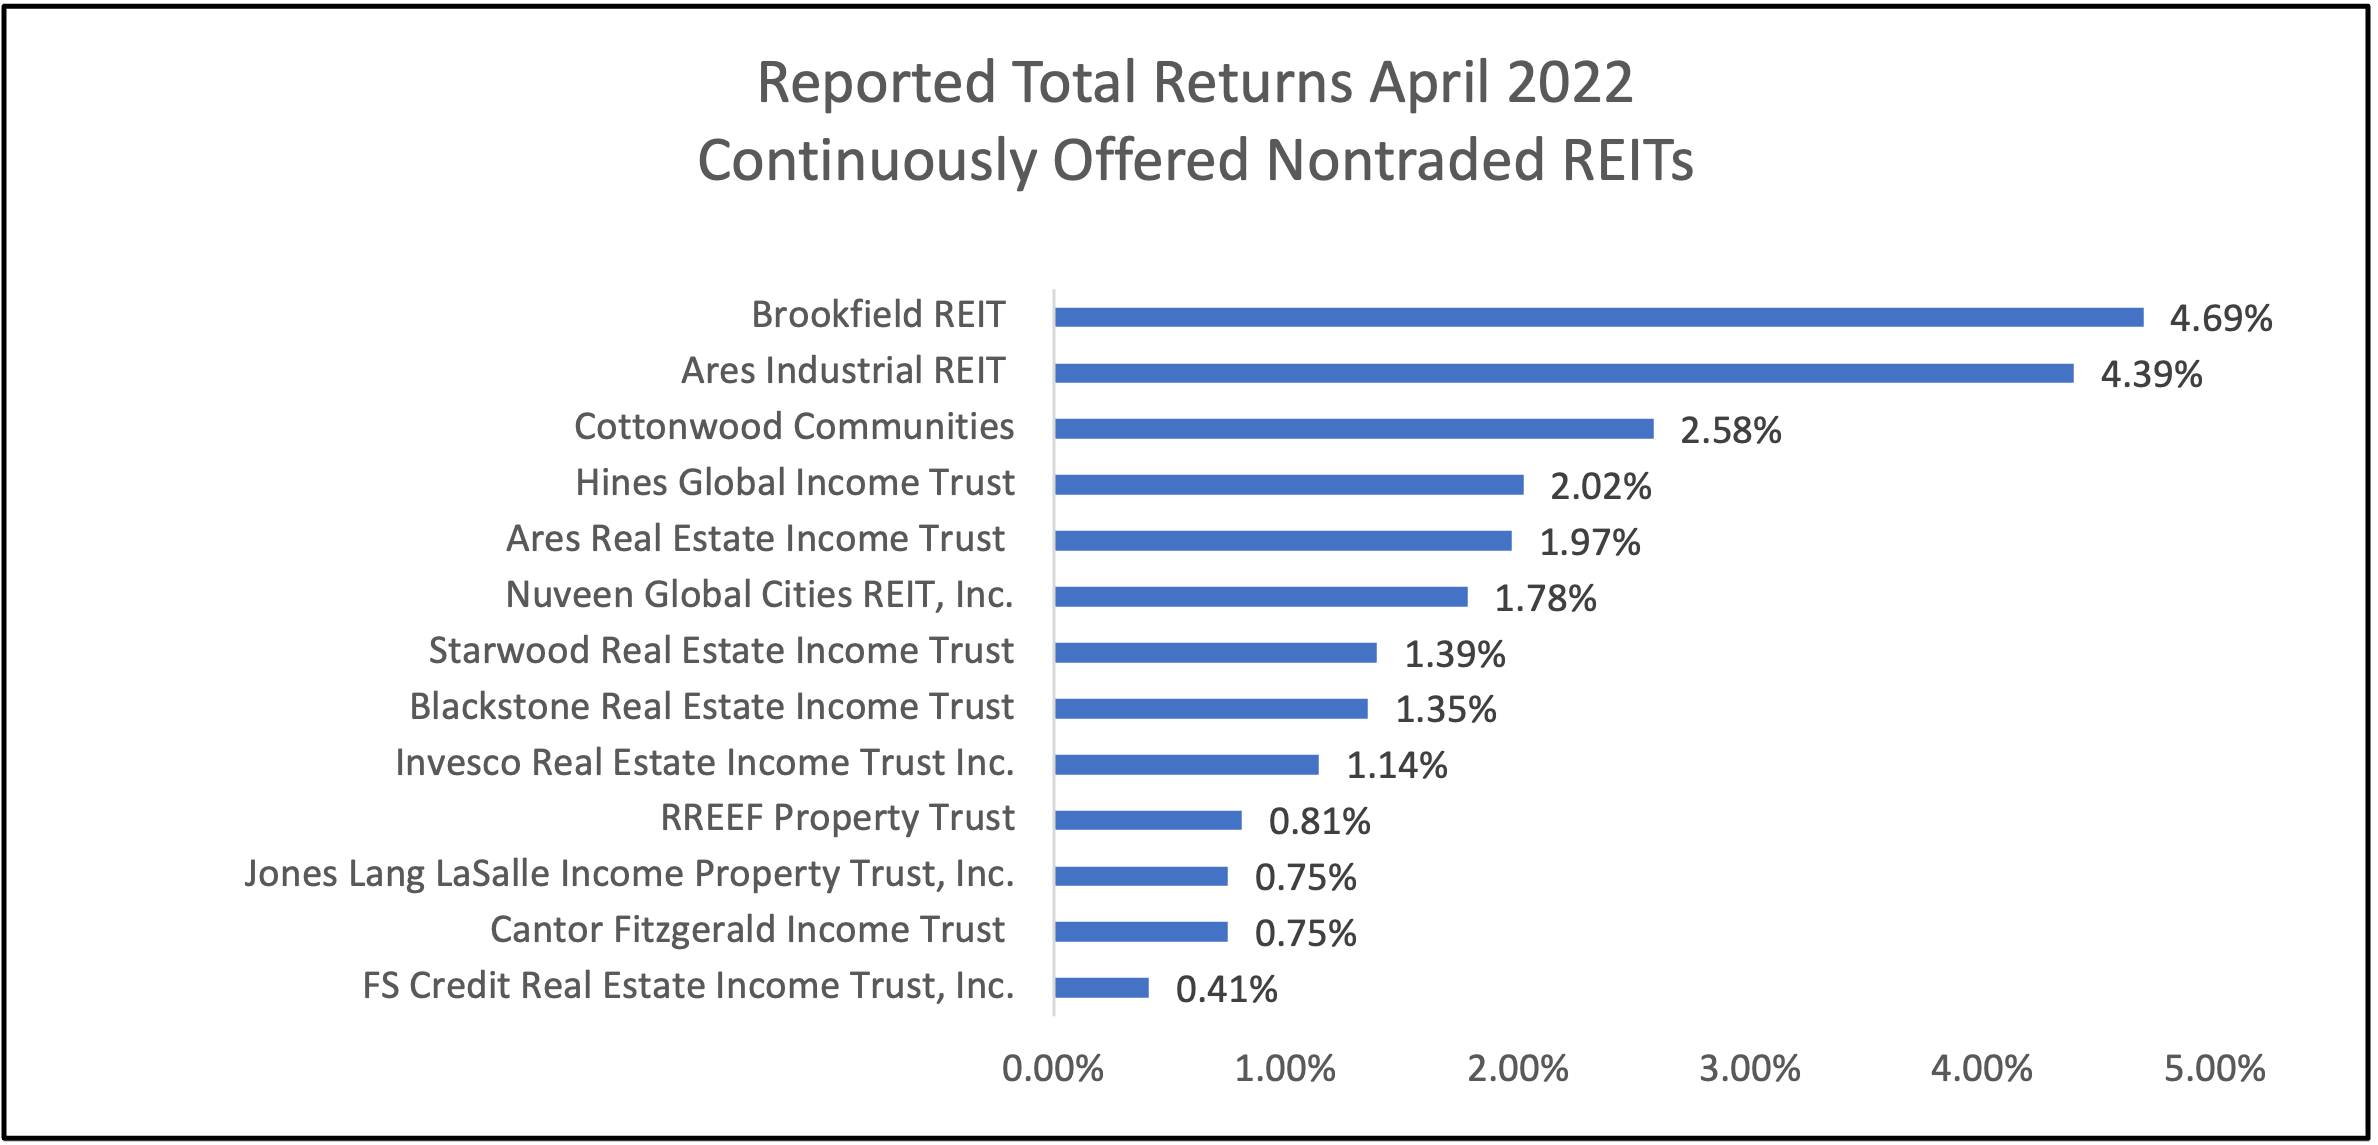
Of course, past results do not guarantee future returns will be comparable, but the patterns of relative risk across these two investment types are significant. Chart III shows the total returns for April 2022 reported by the currently-available NAV REITs. In a month that had the S&P 500 reporting a negative return of 8.72%, none of the nontraded NAV REITs had a negative total return.
Financial advisors who are looking for alternatives to the higher risks of the stock market as well as individual investors seeking income and lower risk would be well-advised to check out these nontraded REIT offerings for the attractive risk vs. return profiles they have provided over the last two years plus.
Sources: Individual REIT Webpages, Blue Vault