Daily and Monthly NAV Nontraded REIT Performance Review for 2018
January 28, 2019 | Maria Smorgonskaya and James Sprow | Blue Vault
Introduction
This report summarizes the 2018 estimated returns to investors in those nontraded REITs that have daily or monthly NAVs announced, with pricing of their shares tied to those NAVs. Seven of these REITs have continuous public offerings with no set closing dates, but Black Creek Industrial REIT IV is an exception and plans to eventually have a full-cycle liquidity event. This group of REITs was joined by Blackstone Real Estate Income Trust in January 2017 and Hines Global Income Trust in January 2018. Other nontraded REITs with monthly or daily NAVs have limited operating history and are not included in this Review.1
In this Review, we calculate estimate simple rates of return to investors in the Class I shares of the daily and monthly NAV REITs for the year 2018, using the distributions paid and the changes in the NAVs of the Class I shares. (for Jones Lang LaSalle Income Property Trust we use Class M-I shares) The simple rates of return do not necessarily reflect the internal rate of return (“IRR”) experienced by investors based upon the initial pricing and ending NAVs of the shares and the distributions paid during the year.
As stated in the SEC filings by each of these REITs, the NAVs do not reflect a market price for the REIT shares since no public market exists for the shares. The NAVs are estimated based upon third-party valuations of the REIT portfolios, other assets, and liabilities, and they are used for pricing the REITs’ issuance of shares, its distribution reinvestment pricing, and share redemption pricing.
These REITs offer investors improved transparency regarding the estimated values of their equity investments, and increased liquidity via the REIT share redemption programs. Investor statement values can be updated more frequently than with the life-cycle REITs that update their NAVs annually. Regarding improved liquidity, the REIT prospectuses describe the quarterly and annual limitations for share redemptions, which typically allow up to 5% of the outstanding shares to be repurchased per quarter. If repurchase requests exceed this limit, the requests are filled on a pro-rata basis and rolled forward to the next quarter. Usually, the repurchase price will be the most recent NAV, unless shares have been held for less than one year, which can be repurchased at 95% of the most recent NAV.
History of the Daily and Monthly NAV Nontraded REITs
On August 15, 2011, American Realty Capital Daily Net Asset Value Trust, Inc. commenced an IPO for two classes of common shares, basing the daily per share purchase price in the IPO on the sum of the NAV for each class of common stock, divided by the number of shares outstanding as of the end of each business day. The net asset values utilized were provided via an agreement with Duff & Phelps. This REIT completed a full-cycle event on December 22, 2016, by liquidating its real estate portfolio and paying a liquidating distribution.
On December 7, 2011, Cole Real Estate Income Strategy (Daily NAV), Inc. broke escrow and began accepting subscriptions for shares of common stock in its initial public offering. The per share purchase price of its common stock varied from day-to-day, and on any given business day was equal to its net asset value or “NAV.” It was structured as a perpetual -life, non-exchange traded REIT. The REIT was renamed CIM Income NAV, Inc. as of November 27, 2017. Pricing and performance data are available at www.cimgroup.com/strategies/individual/inav.
On October 1, 2012, Jones Lang Lasalle Income Property Trust, Inc. (the REIT was originally incorporated in 2004 and had raised private capital) began offering two share classes on a continuous basis. Effective January 1, 2018, the NAV and NAV per share are calculated by ALPS Fund Service Inc. The purchase and repurchase of shares of the REIT’s common stock is based upon the appropriate day’s applicable per share NAV. The daily NAV per share is posted on the REIT’s website at www.JLLIPT.com.
On July 12, 2012, Dividend Capital Diversified Property Fund, Inc. (now Black Creek Diversified Property Fund, Inc.) commenced an ongoing public offering of common stock with NAV-based pricing. This REIT had previously issued shares in its initial public offering that it re-classified as Class E shares and began offering four classes of shares with different class-specific expenses, and as a result, each share class had a different NAV per share. The NAV for each share class is calculated after the end of each business day that the NYSE is open by a third-party firm. Pricing and performance data are available at www.blackcreekdiversified.com.
On November 25, 2014, Industrial Logistics Realty Trust Inc. filed an initial public offering with Class A and Class T shares. On July 1, 2016, the REIT reclassified its common stock offered to Class A, Class T, and Class W Shares. On May 9, 2017, the name of the REIT was changed to Black Creek Industrial REIT IV. On May 19, 2017, it amended its charter to re-designate the Class A shares of common stock as Class I common stock. On July 3, 2017, the REIT began offering three share classes at transaction prices based upon monthly NAVs. Pricing and performance data are available at www.bcindustrialiv.com. The REIT currently plans to have a follow-on offering and eventually to have a full-cycle liquidity event.
On September 20, 2017, Griffin Capital Essential Asset REIT II, Inc. commenced a follow-on offering and re-classified Class T and Class I shares sold in their 2015 IPO as Class AA and Class AAA shares, respectively. The new classes of T, S, D, and I shares are priced based upon the NAV. The share classes have different selling commissions, dealer manager fees, and ongoing distribution fees. Pricing and performance data are available at www.griffincapital.com/griffin-capital-essential-asset-reit-ii/daily-nav.
RREEF Property Trust, Inc. commenced its IPO on January 3, 2013, for shares of its common stock. On July 12, 2016, it began offering four classes of common stock on a perpetual basis. The per share purchase prices for shares of its common stock vary from day-to-day and, and on each day, will equal the NAV per share plus, for Class A shares and Class T shares only, applicable selling commissions and for Class T shares only, an up-front dealer manager fee. The daily net asset value is published on its website at www.rreefpropertytrust.com.
Blackstone Real Estate Income Trust, Inc. broke escrow as of January 1, 2017. As of January 16, 2019, the company had received gross proceeds of approximately $4.8 billion from selling shares of the company’s common stock, consisting of four share classes (Classes S, T, I and D). The purchase price per share of each class of common stock is generally equal to the prior month’s NAV per share, determined monthly, plus applicable selling commissions and dealer manager fees. The NAVs are determined by the REIT’s adviser and its assumptions are reviewed by its independent valuation advisor. Monthly pricing and performance data are available at www.breit.com.
Hines Global Income Trust, Inc., formerly Hines Global REIT II, Inc., began raising capital in August 2014. On November 30, 2017, the REIT redesignated its outstanding shares and created four additional classes of common stock (T, S, D and I), and began determining a new NAV per share on a monthly basis at the end of January 2018. The transaction prices for its shares are the most recently determined NAV per share as of the end of the prior month. The current offering is intended to be a continuous offering with no targeted liquidity date. Monthly pricing and performance data are available at www.hinessecurities.com/current-offerings/hgit/
Advantages of the Daily and Monthly NAV REIT Structure
These nontraded REIT programs with daily or monthly valuations and pricing based upon estimated NAVs per share were designed to give investors improved transparency with regard to their investment values as well as liquidity features that are not available to investors in the traditional life-cycle nontraded REIT program. The REITs also feature multiple share classes, with differing fee structures. Institutional shares (Class I) are sold with no selling commissions or dealer manager fees. Class T shares are typically structured with trailing commissions which are subtracted from the distributions to those shareholders over a time period until the total underwriting costs reach a 10% limit. Class D and W shares are for investors who have fee-based wrap accounts.
Performance of the Daily and Monthly NAV REITs in 2018
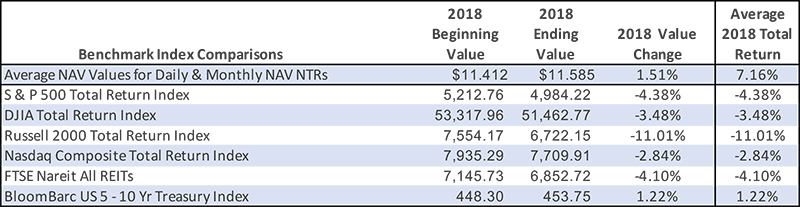
The daily and monthly NAV REITs had estimated returns for 2018 that were impressive when compared to other traditional index returns. Blue Vault estimates the total returns for the eight REITs using their beginning 2018 estimated NAVs and the latest estimated NAVs available for the year 2018. We add all distributions actually paid to shareholders during 2018. The simple return calculation is the change in NAV during 2018 plus the total distributions paid, divided by the beginning NAV. All returns are calculated for the Class I shares. (The returns for other share classes would be lower due to selling commissions and shareholder servicing fees, specific to the share class.) See Table I.
Table I

These estimated rates of return are impressive when compared to the total returns for several traditional indices as shown in Table II. The total returns for the indices include reinvested dividends. The average beginning and ending values for the REITs are based upon their NAVs in Table I, and the Average Total Return is the average of the values of the simple return calculations in Table I.
Table II
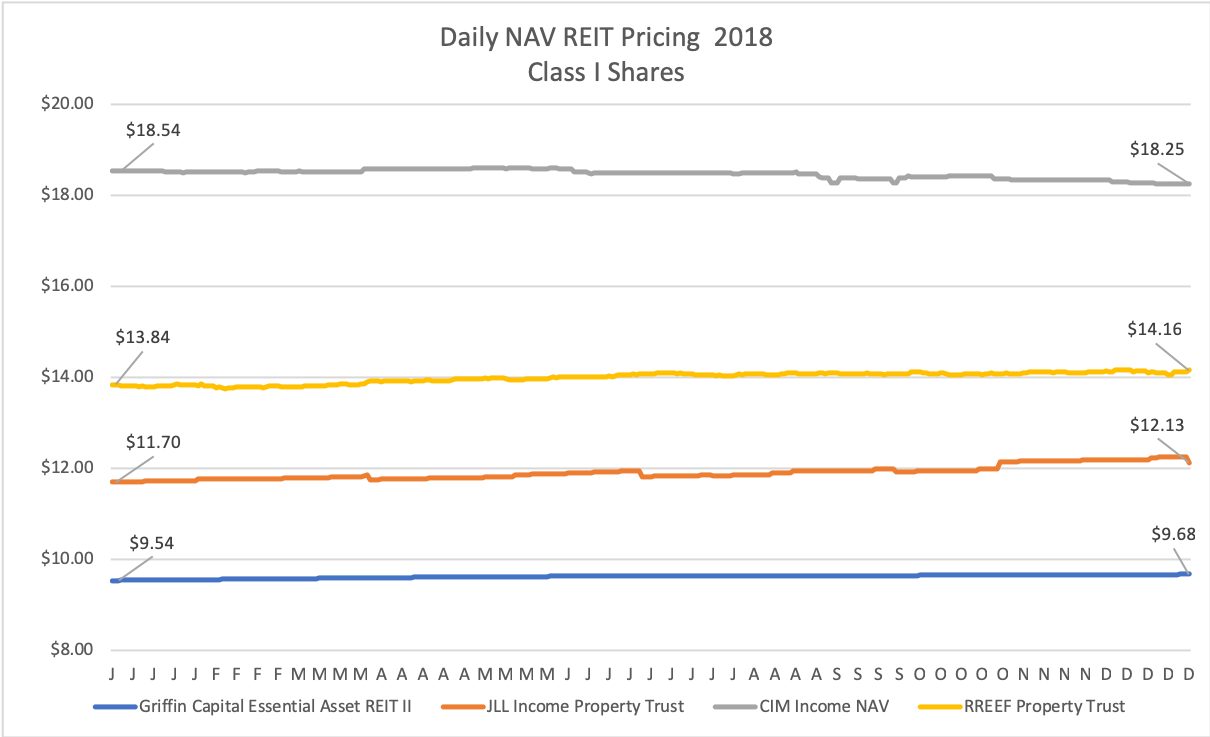
The performance of daily NAV REIT pricing exhibits relative stability not found in the traded security markets. Much of the variation in the NAVs of these REITs is due to the payment of distributions which will lower the NAVs each month when the distributions are paid. The other sources are the changes in the REIT’s portfolio value per share and other assets, less the estimated value of the REIT’s liabilities. These changes will largely result from the third-party appraisals and the REIT’s valuation policies.
Chart I Daily NAV REIT Pricing
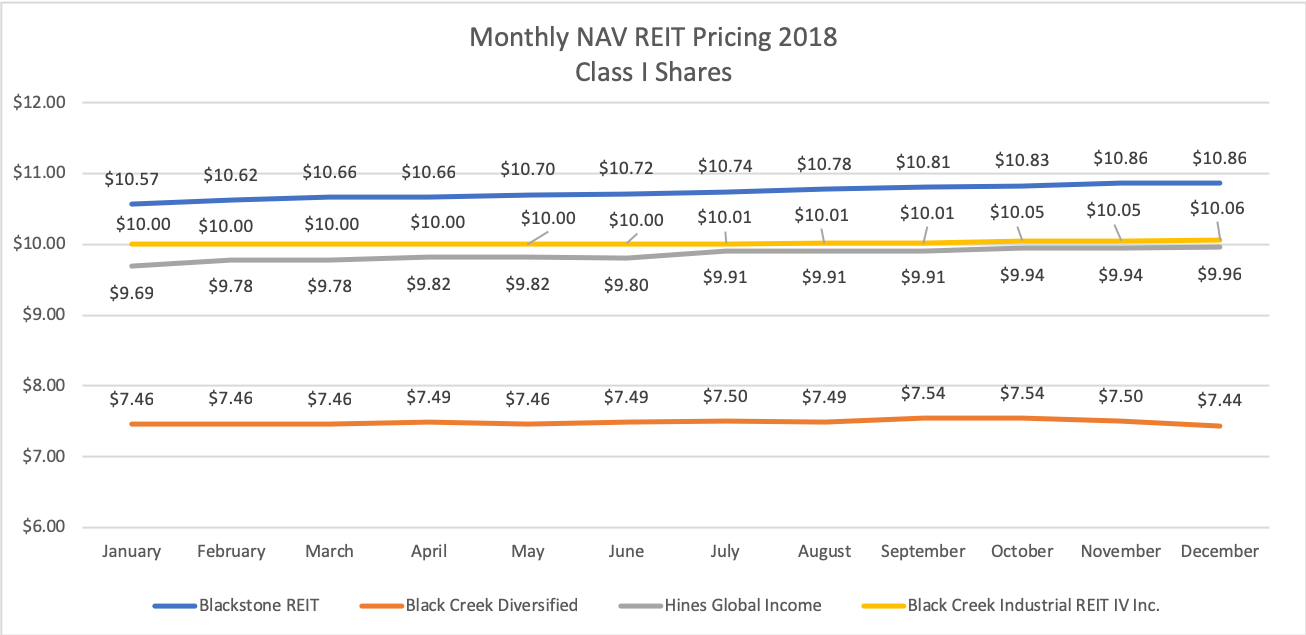
The same factors which influence the trends in NAVs of the daily NAV REITs will impact the estimated NAVs of the monthly NAV REITs. These REIT NAVs display variation that is largely due to increases or decreases in the estimated values of their investment portfolios and their financing liabilities. Because the values are based upon partial third-party appraisals of portfolio values and liabilities on a rolling basis, the monthly variations are relatively minor. Chart II illustrates the pricing for the REITs that provide monthly updated NAVs.
Chart II Monthly NAV REIT Pricing
Investment analysts use metrics to describe the relationships between risk and return for listed stocks. A widely-used metric is the Sharpe Ratio which compares the excess return provided by a security compared to a risk-free rate (such as the yields on short-term Treasuries) divided by the standard deviation of its daily returns. The data required to calculate a Sharpe Ratio is available from the closing prices on listed securities and dividends paid. The variation in pricing from day to day provides the data to calculate the standard deviations of returns.
With daily and monthly NAV nontraded REITs, the data required to calculate risk vs. return metrics such as a Sharpe Ratio are not available. Since the NAVs are not market-determined, there is no basis for utilizing changes in NAVs as a proxy for risk.
In Table III, we show the total variation in each REIT’s NAVs, from the lowest NAV during 2018 to the highest NAV in 2018. As can be seen in the NAV charts above, a good portion of the variation is due to the steady increase in NAVs reported by the REITs.
Table III

In most cases, the total variation in NAV is either largely or completely due to the increase in NAV during 2018.
Conclusion
The nontraded REIT programs that provide daily or monthly NAVs for pricing, reinvestment of distributions and redemptions of their common shares, outperformed the listed shares of common stocks as represented by market indices in 2018. The relative stability of the NAVs for these nontraded REIT programs is in marked contrast to the volatility observed in 2018 in the stock markets. These eight nontraded REIT programs provided their investors with relatively stable rates of return and income, more transparency in pricing compared to traditional life-cycle REITs, and improved liquidity available via share redemption programs.
Sources: SEC, Yahoo!Finance, NYSE, Nasdaq, S&P, Nareit, Blue Vault, Bloomberg
1Additional REITs with limited operations and monthly or daily NAVs and their effective dates include Nuveen Global Cities REIT (January 2018), Oaktree REIT (April 2018), Starwood REIT (December 2017), Rodin Income Trust (May 2018), FS Credit REIT (September 2017).
Disclaimer:
Blue Vault Partners, LLC is not registered as an investment advisor with any federal or state regulatory agency in reliance upon an exemption from such registration requirements as provided for under the Investment Advisors Act of 1940, as amended, and which is available to the publisher of any “bona fide financial publication of general and regular circulation.”
The information set forth in this article is impersonal and does not provide advice or recommendations for any specific investor or portfolio, nor should anything set forth in this article be construed as any sort of solicitation or offer to buy or sell any security. No investor should make any investment decision without first consulting his or her own personal financial advisor and conducting his or her own research and due diligence, including carefully reviewing the prospectus and other public filings of the issuer.
Investing involves substantial risk. Blue Vault does not make any guarantee or other promise as to any results that may be obtained from using its research. While past performance may be analyzed in this article, past performance should not be considered indicative of future performance and there can be no guarantee that similar results will be attained in the future. To the maximum extent permitted by law, Blue Vault Partners, LLC, and its respective affiliates disclaim any and all liability in the event any information, commentary, analysis, opinions, and/or recommendations set forth in its publications prove to be inaccurate, incomplete or unreliable, or result in any investment or other losses.
For further information about Blue Vault Partners, please see our website at www.bluevaultpartners.com.