James Sprow | Blue Vault |
In this article we look at the possibilities of diversification across the current offerings of continuously offered nontraded REITs. These REITs are offering their shares, in multiple share classes with different upfront fees, each month at their respective net asset values per share. The net asset values are revised monthly for most of the REITs, and with those revised net asset values and the distributions that are paid, we are able to calculate the monthly total returns to shareholders. Of course, unlike listed REITs that can be liquidated at any time, shareholders in nontraded REITs are limited in the number of shares that can be redeemed in any given month, also at the net asset values per share. Therefore, without the certainty of being able to liquidate shares at the net asset values, total returns are somewhat hypothetical in nature and assume the ability to liquidate shares. Currently, all shareholder requests for redemptions of their shares are being satisfied by most continuously offered nontraded REITs, but there are no guarantees that this would be the case over any future time period.
Portfolio theory rests on assumptions about the correlations of returns among different investments. In this exercise, we calculate the correlations of monthly returns across a set of 11 continuously offered nontraded REITs. When those monthly returns are not highly correlated, theory suggests that a portfolio can be constructed that will lower the standard deviation of the portfolio returns below the average standard deviations of returns for the REITs, while offering a portfolio return that is the weighted average return for those REITs. By diversifying across investments that are not highly correlated, it may be possible to achieve the desired result of lowered risk for a given expected rate of return.
We start by calculating the correlations between 27 monthly total returns for the 11 continuously offered nontraded REITs. We use the returns to the Class I shares in all but two cases. In the correlation matrix below, the color coding shows the correlations ranked in quintiles where green cells are the highest correlations and red cells are the lowest correlations among the sample.
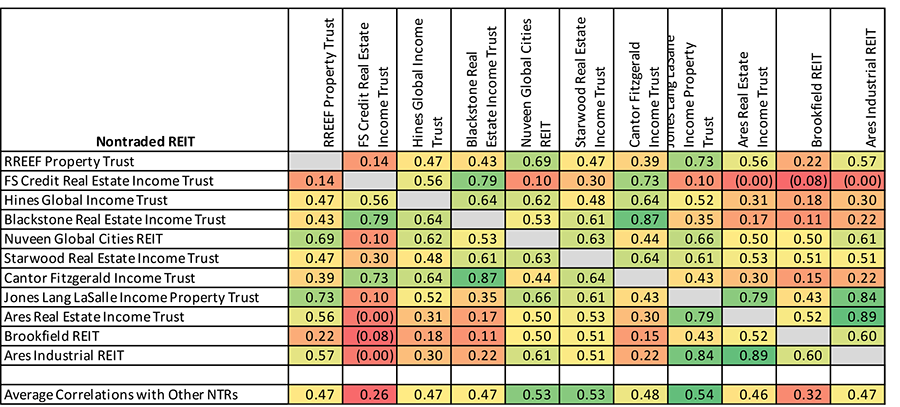
In our first set of correlation calculations we notice, that with a few notable exceptions, the lowest correlations between REIT returns are for FS Credit Real Estate Income Trust. This REIT holds a portfolio of real estate debt investments and no real properties. Looking at the 27 monthly returns for each nontraded REIT that were used in the correlations calculations, we take note of the returns in March of 2020. In that month there were extreme total returns. For example, the nontraded REIT with the highest average monthly return and total return over the study period, Blackstone REIT, posted a total return in March 2020 of negative 8.11%. Cantor Fitzgerald Income Trust reported a total return in that same month of negative 4.93%. Hines Global Income Trust reported a negative return of 3.40% for that month. These extreme observations resulted in anomalous correlations with FS Credit Real Estate Income Trust which only reported one negative return in the 27-month data.
We re-calculate the correlations between the monthly returns for all REITs by deleting the March 2020 observations and find a strikingly different result, as shown below.
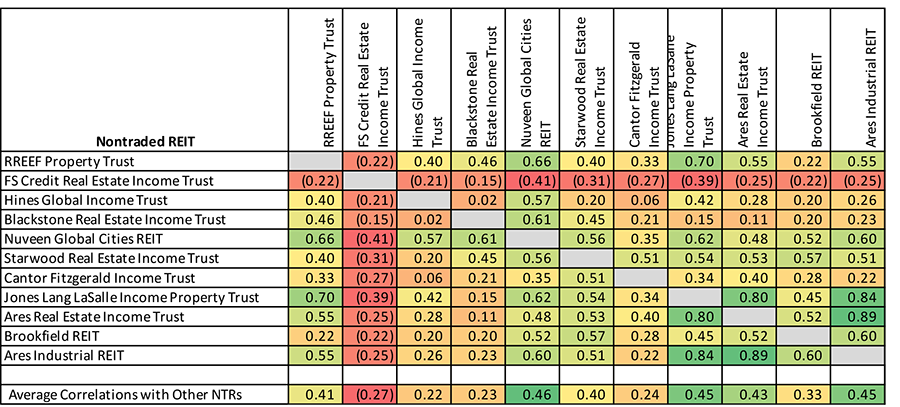
By eliminating the observations for one month, March 2020, the correlations change dramatically. Now, the single REIT that invests only in credit instruments, has returns that are negatively correlated with the other 10 REITs.
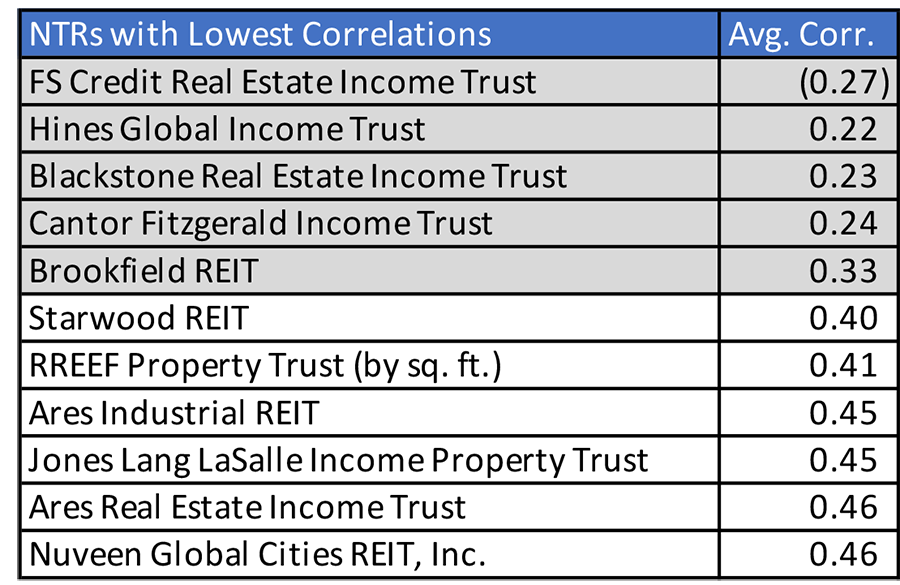
The next exercise is to select five of the REITs to combine in a hypothetical portfolio to see if there is a potential for risk reduction via diversification. We selected the following five REITs (shaded) based upon their low average correlations with each of the other ten REITs.
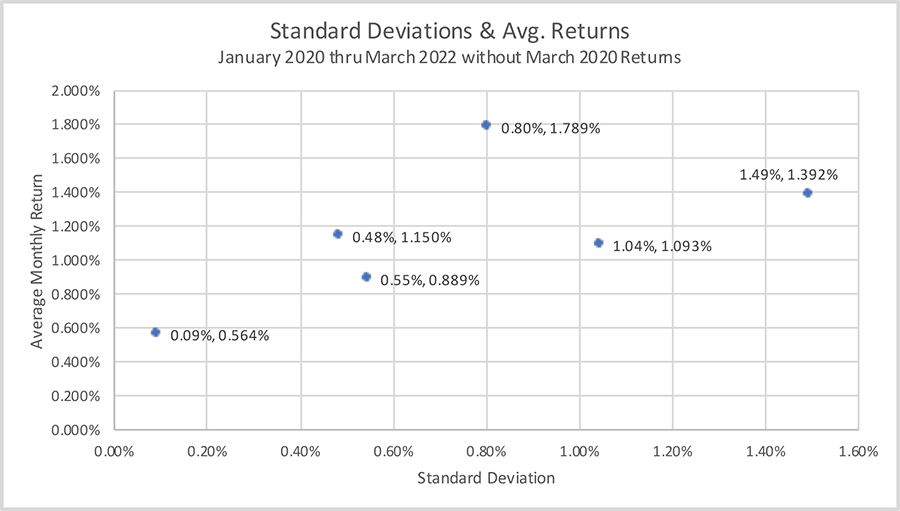
We now calculate the hypothetical 27-month return for a portfolio made up of an equal allocation across the five selected REITs and plot their individual monthly returns and standard deviations over the sample period along with the hypothetical portfolio monthly return and standard deviation.

In the following plot, the portfolio average monthly return and standard deviation (1.150%, 0.48%, respectively) for the portfolio has a higher return than three of the REITs and a lower standard deviation than all but one of the five REITs. While the average monthly portfolio return is lower than that of the Blackstone REIT (1.789%) and the Brookfield REIT return (1.392%) it displays considerably lower risk as measured by the monthly standard deviation (0.48% for the portfolio vs. 0.80% for Blackstone REIT and 1.492% for Brookfield REIT).
Conclusion
A portfolio of five continuously offered nontraded REITs with reasonably low correlations between their respective returns has potential for significant reduction in portfolio risk while offering a return that is the weighted average of the respective REIT returns. In future articles, we will explore the returns experienced by the continuously offered nontraded REITs and the returns on listed stocks as represented by the S&P 500 index and debt securities as represented by bond indices. Will diversification using nontraded REITs reduce the volatility of a portfolio and potentially offer a favorable risk/return tradeoff?
Sources: Individual NTR Websites