Economies of Scale in Nontraded REIT Offerings and Effects of Fee Discounts

Two complicating factors that must be considered in the analysis of fees associated with nontraded REIT offerings are:
- Economies of scale resulting from that portion of fees and/or expenses that are fixed or constant over a relevant range of offering proceeds
- Selling commission discounts available to investors for larger investments (commonly known as “volume discounts” or “price breaks”)
Economies of Scale in Organization & Offering Expenses
We can illustrate the first example by looking at the language in a typical prospectus that details the Organization & Offering Expenses to be reimbursed to the advisor. For the year ended December 31, 2015, one nontraded REIT recorded Organization and Offering Expenses incurred by the REIT’s advisor on behalf of the REIT that it was obligated to pay at $4.6 million. During that same period, the offering had raised $470.4 million in aggregate gross proceeds. At that stage of the offering, therefore, the Organization & Offering Expenses totaled 0.97% of gross offering proceeds. In the same filing, the prospectus states that “Other Organization and Offering Expenses” are projected to be 0.55% of public offering proceeds with the “Maximum Sale of Class A Shares in the Offering” and 0.86% of public offering proceeds with a “Half Offering” or 50% of the total offering authorized.
Looking at the numbers, there is a “fixed cost” component of Organization & Offering Expenses that will be spread over the total offering proceeds, resulting in what economists refer to as “economies of scale,” meaning those expenses will be a lower percentage of the total offering proceeds as that total increases. It is not unusual for a nontraded REIT offering to fall far short of the total offering proceeds that are stated in the prospectus. In the above example, the REIT had raised aggregate proceeds of $530.9 million as of September 30, 2016, with a closing date of March 31, 2017, just six months away. Thus, the REIT had raised just under 40% of the authorized $1.4 billion, and less than 5% of the $1.4 billion over the first nine months in 2016. It is not unreasonable to doubt that the Organization & Offering Expenses estimated as a percentage of the offering proceeds will approach the low estimate of 0.55%, and it is more likely that, due to the fixed component of those expenses and the slowing of capital raise, they will be more than 0.86%.
Another example is in a the recently closed offering that had raised $678.0 million, including DRIP proceeds as of September 17, 2016, the date it terminated the offering. The offering prospectus dated August 28, 2013, stated that the REIT expected to reimburse its advisor a total of $59.5 million for both underwriting expenses and other organization and offering expenses if it raised the maximum offering proceeds of $2.975 million including DRIP. These expenses were expected to be 2.0% of gross offering proceeds for any level of offering proceeds, and the 2.0% was given for the minimum offering proceeds as well as the maximum offering proceeds, implying that there was no fixed component in those expenses that would be reimbursed to the sponsor. The prospectus language was: “All other organization and offering expenses associated with the sale of the Company’s common stock (excluding selling commissions and dealer manager fees) are paid by [the Advisor] or its affiliates and are reimbursed by the Company up to 2.0% of aggregate gross offering proceeds.” Given this language in the prospectus, there would be no economies of scale expected for the REIT with regard to these expenses. Several months before this offering closed, more than 2.0% of the gross proceeds for organization and offering expenses had been paid by the advisor and were to be reimbursed by the REIT, up to the 2.0% limit.
Selling Commission Discounts Available to Investors
The actual percentage of gross offering proceeds that will be paid as selling commissions will depend upon the discounts available to investors for different subscription amounts, as well as the portion of the offering that consists of DRIP proceeds (distributions reinvested for which there is no selling commission charged). A sliding scale of selling commissions for volume purchases will look like the following:
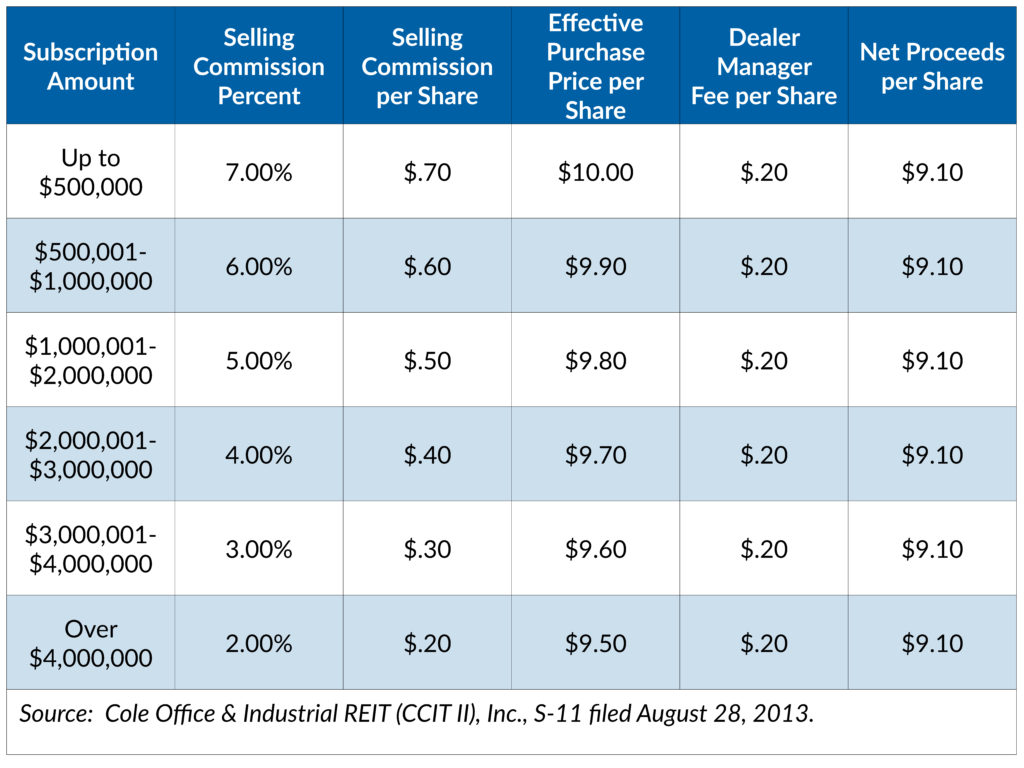
The discount is applied as a reduced effective purchase price per share and does not affect the net proceeds per share to the REIT in this example. The total selling commissions paid for any offering will be the result of the actual mix of purchases by subscription size. In the above example, the 7.00% commission level would only be accurate for the completed offering if all subscriptions were for less than $500,000 and no DRIP proceeds were received. With this in mind, investors who receive a selling commission discount or who pay no selling commission on their DRIP investments will experience a higher average rate of return from their investments over the life of the REIT program than those investors who pay the highest selling commission rate of 7.00%.
Returning to the offering in the previous example, the REIT’s estimate of the percentage of public offering proceeds to be paid as selling commissions is less than the 7.0% rate due to the category of investor or volume discounts available. Using assumptions made by the adviser for the sales mix, the prospectus estimates the selling commission percentage as 6.77% of proceeds from Class A shares and just less than 2.00% for Class T shares.
Conclusion
When we analyze the fees paid by nontraded REITs as selling commissions or any other expenses related to their offerings, it is important to keep in mind that there may be:
- Economies of scale that affect the actual percentage of the offering going to pay fees, depending upon the total gross proceeds actually raised in the offering
- Lower selling commissions as a percentage of the gross offering proceeds due to volume discounts, differences between share class commission rates, and DRIP proceeds that do not have selling commissions
Blue Vault will release it first ever comprehensive Nontraded REIT Fee Study at the end of this month. The study provides in-depth analysis of all fees associated with nontraded REIT investments currently offered, including definitions of the fees, how the fees impact shareholder returns, and a complete data set with each of the REIT’s share class fees as well as ranges, averages, and medians for the industry. Watch for upcoming information about pricing and how to purchase this report.
**Insights are exclusive “Subscriber Only” content. NewsWire recipients have access to these articles the day they are published, however, 24 hours after publication, they will no longer be available without a subscription to Blue Vault research. For more information about becoming a subscriber, please email or call Dawn McDaniel at 678-456-4787.