
Current DST offerings provide important information about an investment available today. But when advisors evaluate a sponsor, the current offering is only part of the picture.
Historical sponsor information can add another layer of context: how many programs have closed, how many have gone full cycle, how completed programs have performed, and how much history is available to review.
Blue Vault reviews sponsor-issued DST materials to organize the historical information sponsors provide and make that comparison easier.
What Blue Vault Identified
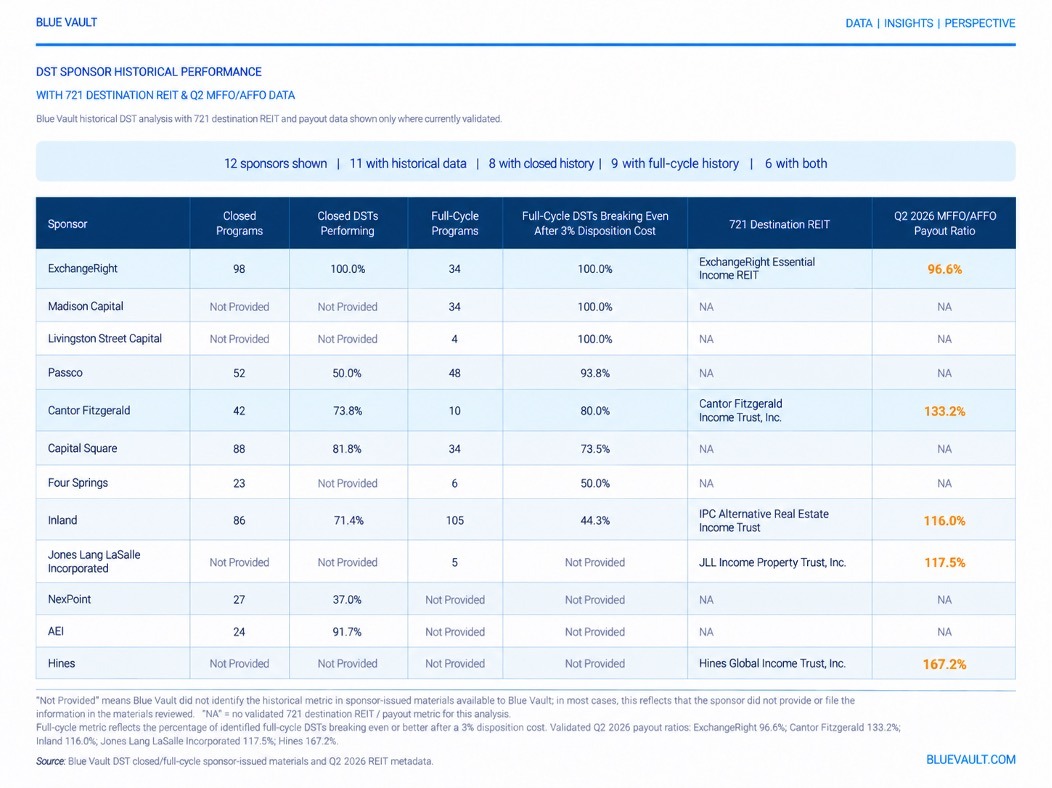
Blue Vault’s current analysis includes 12 DST sponsors. Historical closed-program and/or full-cycle performance information was identified for 11 of those sponsors.
- 11 Sponsors with historical performance data available
- 8 sponsors with closed-program history available
- 9 sponsors with full-cycle history available
- 6 sponsors with both closed-program and full-cycle history available
The analysis also includes relevant 721 destination REIT and Q2 2026 MFFO/AFFO payout information where Blue Vault has validated the relationship and metric.
What the Data Shows
-
ExchangeRight, Madison Capital and Livingston Street Capital each show 100.0% of identified full-cycle DSTs breaking even after a 3% disposition cost; the depth of the identified history differs materially at 34, 34 and 4 full-cycle programs, respectively.
-
Passco has 48 identified full-cycle programs, with 93.8% breaking even after the 3% disposition cost. Its closed-program dataset contains 52 programs, with 50.0% classified as performing under the Blue Vault closed-program methodology.
-
Cantor Fitzgerald has 42 identified closed programs and 10 full-cycle programs. The corresponding metrics are 73.8% of closed DSTs performing and 80.0% of full-cycle DSTs breaking even after the 3% disposition cost.
-
Inland has the largest identified full-cycle program count in this dataset at 105. Its full-cycle break-even metric is 44.3%.
-
Jones Lang LaSalle has 5 identified full-cycle programs in the data reviewed, but a comparable full-cycle break-even percentage is not provided in the sponsor-issued DST materials reviewed.
-
Hines is included because Blue Vault has validated its 721 destination REIT and Q2 2026 REIT payout metric. Closed-program and full-cycle DST historical performance metrics are not provided in the sponsor-issued DST materials reviewed for this analysis.
-
Only six sponsors in the reviewed universe have both closed-program and full-cycle historical data identified by Blue Vault, illustrating how uneven the depth of historical reporting remains across sponsors.
721 Destination REIT Context
For sponsors with a validated 721 destination REIT, Blue Vault can connect DST sponsor analysis with the operating performance of the potential destination vehicle. The Q2 2026 MFFO/AFFO payout ratio provides additional context around current distribution coverage.
- ExchangeRight — ExchangeRight Essential Income REIT: 96.6% Q2 2026 MFFO/AFFO payout ratio
- Cantor Fitzgerald — Cantor Fitzgerald Income Trust, Inc.: 133.2% Q2 2026 MFFO/AFFO payout ratio
- Inland — IPC Alternative Real Estate Income Trust: 116.0% Q2 2026 MFFO/AFFO payout ratio
- Jones Lang LaSalle — JLL Income Property Trust, Inc.: 117.5% Q2 2026 MFFO/AFFO payout ratio
- Hines — Hines Global Income Trust, Inc.: 167.2% Q2 2026 MFFO/AFFO payout ratio
Under Blue Vault methodology, a payout ratio of 100% or less indicates full distribution coverage. Lower payout ratios are better for coverage.
|
QUICK READ ExchangeRight is the only one of the five validated destination REITs in this table with a Q2 2026 MFFO/AFFO payout ratio at or below 100% (96.6%). Cantor Fitzgerald, Inland, JLL and Hines are above 100% for the quarter. |
Why Historical Sponsor Data Matters
DST due diligence often begins with the current offering — property, leverage, cap rate, projected distributions, market and exit structure. Those items matter. Historical sponsor information answers a different question: what has happened across prior programs and actual exits?
The level of historical performance reporting varies considerably by sponsor. For several sponsors, substantial closed-program and/or full-cycle histories are included in sponsor-issued materials. For others, little or no comparable historical performance information is provided.
Historical results do not make future outcomes predictable, and a single percentage should never be treated as a complete assessment of a sponsor. They do, however, provide advisors with additional context beyond the terms of one current offering and make differences in the depth of sponsor history easier to see.
Methodology & Definitions
Closed DSTs Performing: Calculated from the historical closed-program dataset as 100% minus the sponsor’s percentage of closed DSTs classified as underperforming.
Full-Cycle DSTs Breaking Even after 3%: Calculated as 100% minus the sponsor’s percentage of full-cycle DSTs that did not break even after applying a 3% disposition/sales cost. This is the Blue Vault full-cycle metric used in this release.
Not Provided: Blue Vault did not identify the applicable historical metric in the sponsor-issued materials reviewed. In most cases, this reflects that the historical information was not provided or filed by the sponsor in those materials. Blue Vault may not capture every available source, so “Not Provided” should not be read as definitive confirmation that no such information exists.
NA: Used where Blue Vault has not validated an applicable 721 destination REIT or payout metric for this analysis.
REIT MFFO/AFFO Payout Ratio: Q2 2026 quarter metric from the Blue Vault REIT dataset. A payout ratio of 100% or less indicates full distribution coverage under Blue Vault methodology; lower payout ratios indicate stronger coverage.
Transparency Continues to Improve
Blue Vault will continue reviewing sponsor-issued materials, tracking historical DST outcomes and incorporating additional performance information as sponsors make it available.
Sponsors that believe additional historical information should be reflected in Blue Vault’s analysis are encouraged to provide the applicable sponsor-issued materials for review.
For Advisors
Blue Vault provides qualified wealth advisors with free access to alternative investment research, performance data and market intelligence across DSTs, nontraded REITs, BDCs, interval funds and tender offer funds.