Johnathan Rickman | Blue Vault
For the last 15 years, Blue Vault has helped wealth advisors navigate the alts space with clarity and confidence by gathering and reporting on metrics that help investors gauge the performance of nontraded REITs, business development companies, interval funds, and tender offer funds. Our members gain access to in-depth performance-based research on those and other types of private securities offerings through our searchable portal, regular reports, and individual performance pages.
We’ve unlocked the vault to bring you an exclusive look at the latter: an individual performance page for Angel Oak Strategic Credit Fund — one of the 42 credit-focused interval funds we track. Let’s review its performance results from top to bottom:
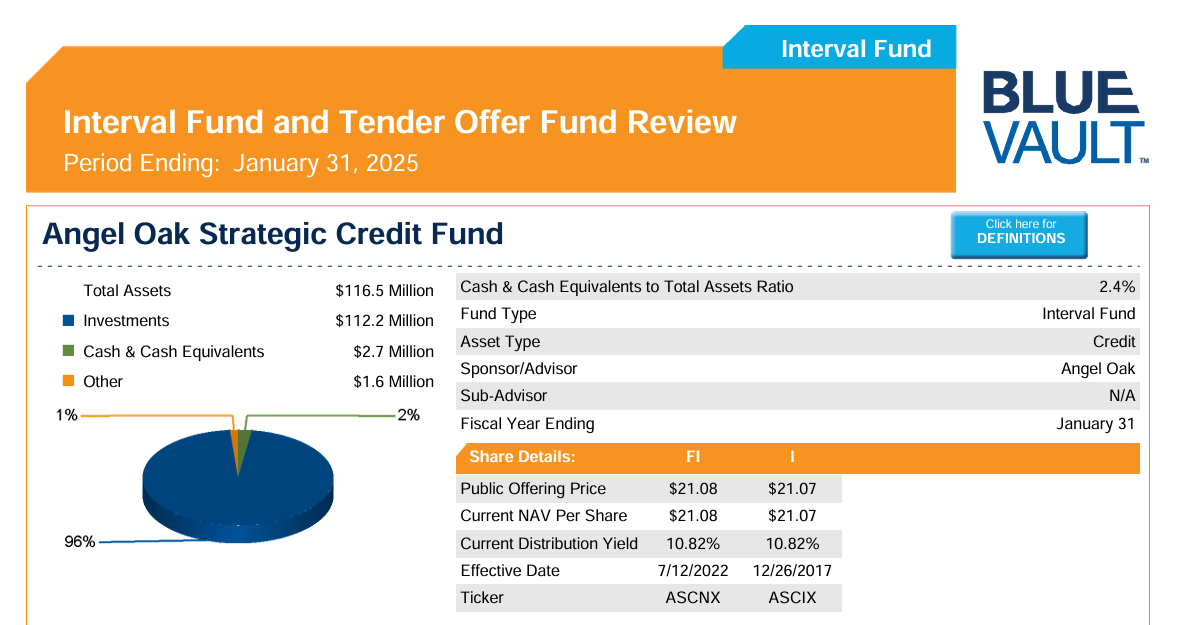
Each individual performance page leads with the period of coverage — in this case, the period ending January 31, 2025 — and a summary of the portfolio holdings for the current period as reported on the fund’s balance sheet.

The performance page continues with the historical NAV trend, illustrated over a rolling two-year period. That metric is followed by risk measures, calculated using an adjusted NAV figure defined as the reported NAV plus any distributions paid during the period.
This is followed up by a description of the fund’s stated investment strategy (not shown) and two additional sets of metrics: net offering proceeds and historical distribution rates:
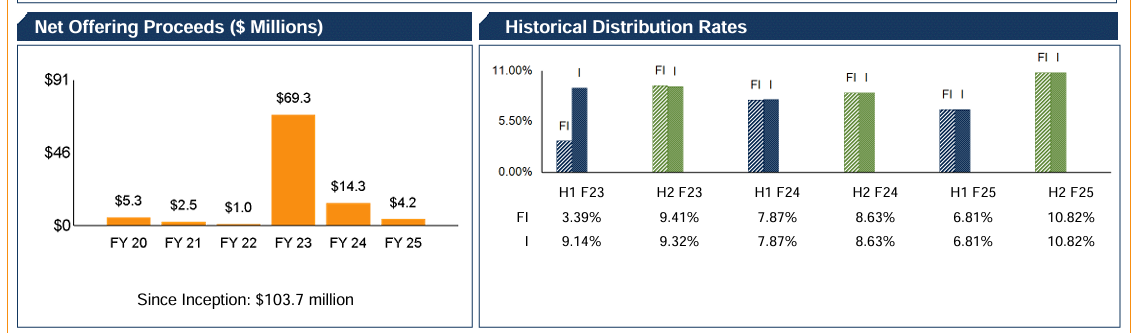
We define net offering proceeds as the sales of the fund plus shares purchased through dividend reinvestment plans, less any shares repurchased through liquidity programs. The latter shows the actual distributions paid per share in dollars over the last six periods, defined as periods in the fund’s fiscal year.
Next, we look at distributions and earnings and review the fund’s portfolio by asset type:
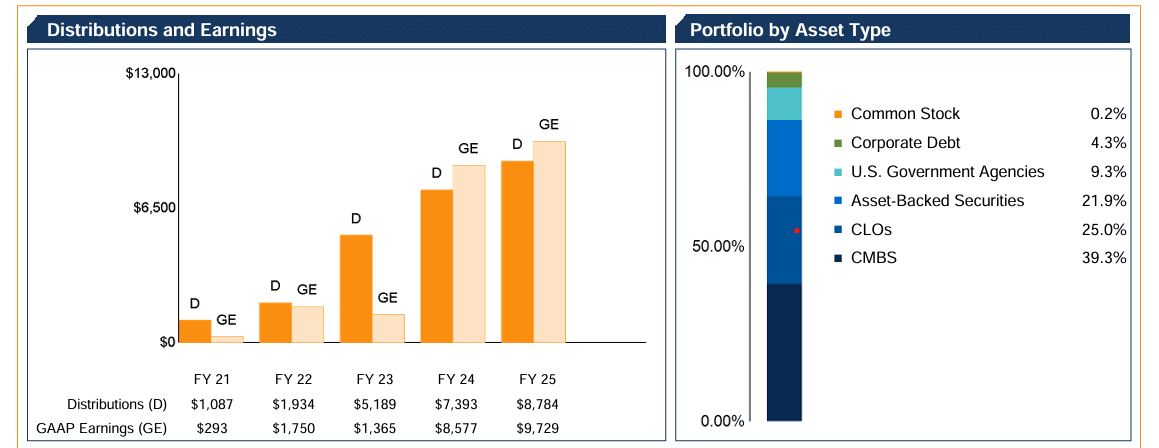
The first chart compares the GAAP-defined earnings (increases/decreases in net assets resulting from operations) to the distributions the fund has paid. This shows whether the fund earned enough through operations to cover total distributions paid during the period. The second chart breaks down the interval fund’s portfolio by asset type in percentages.
The performance page continues with charts on portfolio yields and share repurchases:
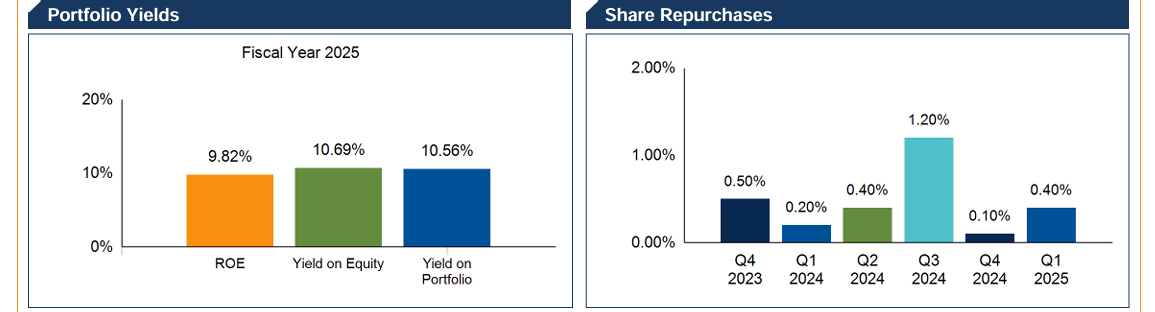
The chart on the left covers fiscal year 2025 and shows return on equity, yield on equity, and yield on portfolio. The latter metric is calculated as the annualized total investment income divided by the average total dollar amount of investments (less short-term investments) for the period.
This is followed by other important metrics such as performance returns, key statistics, and contact information for the fund:
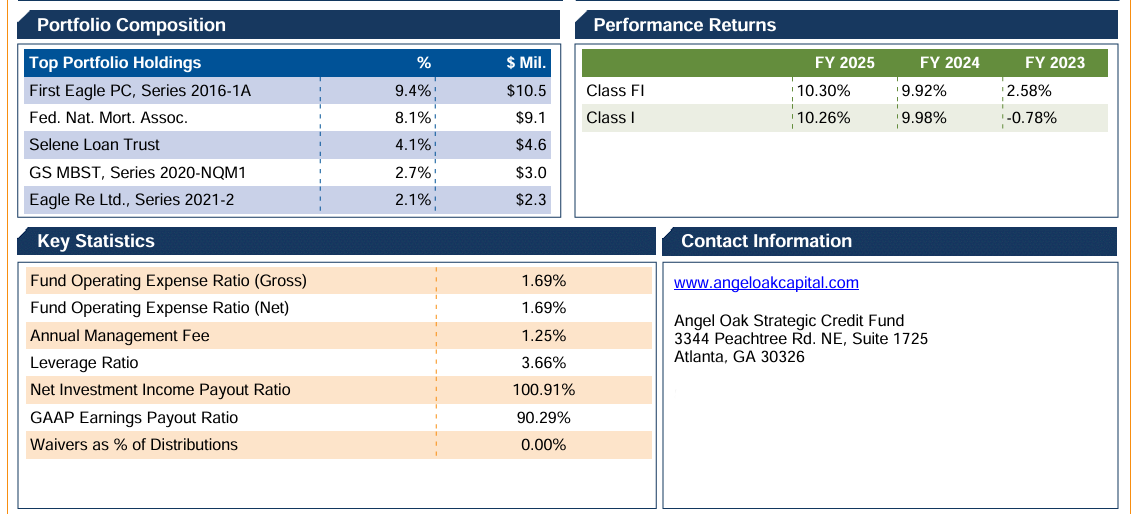
Portfolio composition shows the fund’s top holdings by dollar amount and as a percentage of total investments (less short-term investments). Key statistics include the fund’s annual management fee, net investment income payout ratio, and leverage ratio, the latter of which is calculated as total borrowings divided by total assets.
Curious to learn more about our research? Explore becoming a Blue Vault member and how our performance data can help build your advisory practice. Are you an asset manager, broker-dealer, or other entity? Contact us today to see how we can help you.